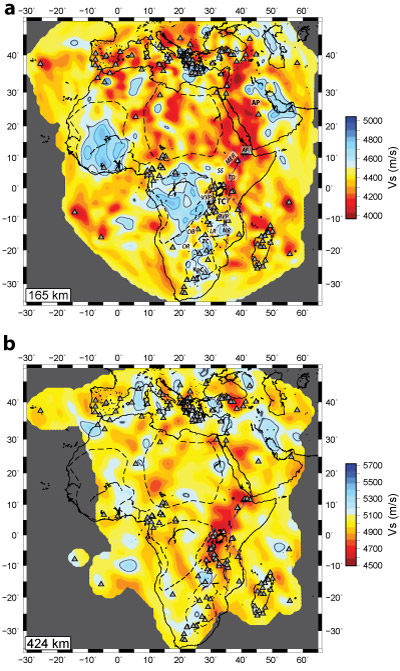
Figure 2. Two depth slices showing shear velocity at a) 165 km and b) 424 km, modified from Emry et al. (2019). For each depth, the color scale (m/s) is centered around the shear velocity in AK135 for that depth. Coastlines are shown as thin black lines, gray and blue lines indicate velocities that are 1.7% and 5% greater than AK135 model. Gray triangles show stations that inform the inversion. Abbreviations are as in Figure 1.