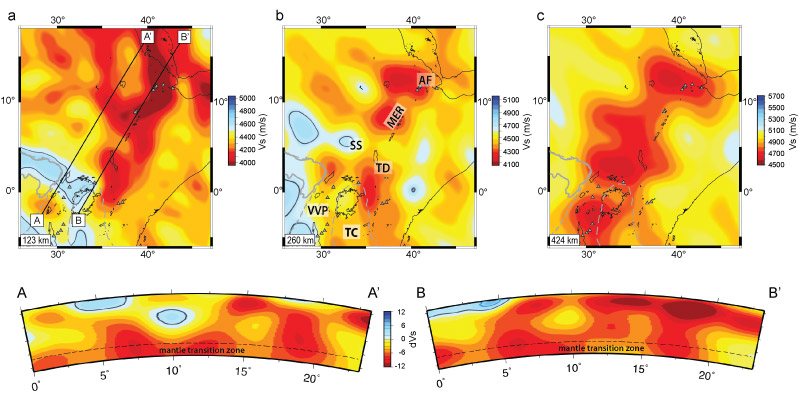
Figure 3. Three depth slices from the Turkana-South Sudan and Ethiopian Plateau regions showing shear velocity at a) 123 km, b) 260 km, and c) 424 km, modified from Emry et al. (2019). Cross-sections correspond to lines plotted on a. Abbreviations explained in Figure 1.