
Erica Emry1, Andrew Nyblade2, and Yang Shen3
1New Mexico Tech, 2Penn State University, 3University of Rhode Island
The East African Rift System (EARS) was one of the GeoPRISMS primary sites within the theme of Rift Initiation and Evolution, because of the variety of rifting stages and styles exhibited along this margin and because of the number of science questions that can be addressed there. Along this margin and in neighboring regions of Africa, Europe, and the Middle East, many broadband seismic instruments have been previously deployed, and numerous studies have explored the subsurface structure over a broad range of scales. However, there is often a disjoint between features that had been previously imaged through smaller-scale, regional tomographic inversions and those imaged by larger-scale inversions. In a recent tomographic study of the upper mantle beneath Africa, we used a full-waveform tomography method, constrained by long-period signal from ambient seismic noise to image the upper mantle beneath Africa to the top of the mantle transition zone (Emry et al., 2019). We found good agreement with prior models, at both large and regional scales, and we imaged new features in higher detail beneath more poorly resolved segments of the EARS. Here, we highlight the overall patterns along the EARS and focus on the complexity observed beneath the Turkana region.
What did we do?
We gathered continuous seismic data for more than 800 seismic stations and extracted Rayleigh waves from ambient seismic noise at periods as high as 340 seconds (Shen et al., 2012). Long period signal is valuable, because it is sensitive to structure deeper in the upper mantle and allows us to resolve down to about 350 to 400 km. Of the more than 800 seismic stations, we identified stations that provided clear signal at 40-340 seconds and used them to constrain our inversion (Fig. 1). This was a new set of data that had not yet been used to image the deeper lithosphere and asthenosphere beneath Africa.
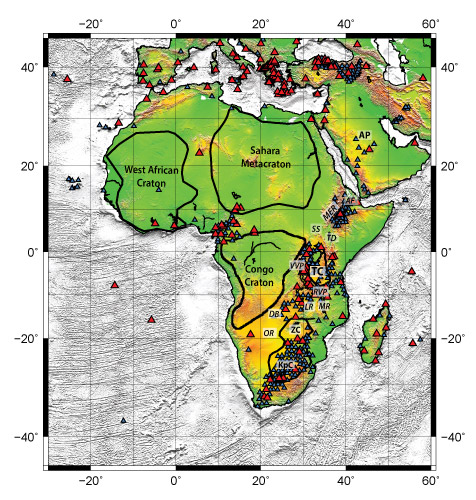
Figure 1. Station map modified from Emry et al. (2019). Cratons are outlined in thick black lines. Blue triangles denote stations for which ambient noise data were collected and red triangles show stations that were used to invert for tomography. Abbreviations are as follows: AF-Afar, AP-Arabian Peninsula, DB–Damara Belt, KpC–Kaapvaal Craton, LR–Luangwa Rift, MER–Main Ethiopian Rift, MR–Malawi Rift, OR–Okavango Rift, RVP–Rugwe Volcanic Province, SS–South Sudan, TC–Tanzania Craton, TD–Turkana Depression, VVP–Virunga Volcanic Province, ZC–Zimbabwe Craton.
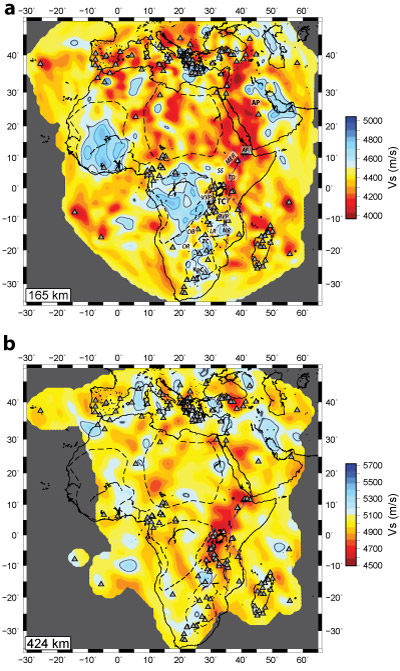
Figure 2. Two depth slices showing shear velocity at a) 165 km and b) 424 km, modified from Emry et al. (2019). For each depth, the color scale (m/s) is centered around the shear velocity in AK135 for that depth. Coastlines are shown as thin black lines, gray and blue lines indicate velocities that are 1.7% and 5% greater than AK135 model. Gray triangles show stations that inform the inversion. Abbreviations are as in Figure 1.
Although other seismic phases are often used to constrain full-waveform tomographic models, we used Rayleigh waves, as it is the principal phase extracted from seismic ambient noise. We used high-performance computing (HPC) clusters at the University of Rhode Island Graduate School of Oceanography to simulate waves propagating through a laterally variable Earth structure. Once synthetic waveforms were calculated for each seismic source in the model, we measured misfit between synthetic Rayleigh waves and those extracted from the data, determined the volume of Earth that influences the traveling wave, and inverted to identify a better-fitting model. For each new model, these steps were repeated until minimal change was made to the model. Our final results provide the absolute, isotropic, shear wave velocity (Fig. 2).
New results from the East African Rift System
There were many similarities between our results and prior studies of the EARS in regions where dense seismic or magnetotelluric arrays have been previously located (Benoit et al., 2006; Bastow et al., 2008; Adams et al., 2012; Mulibo and Nyblade, 2013; O’Donnell et al., 2013; Civiero et al., 2015; Gallacher et al., 2016; Accardo et al., 2017; Yu et al., 2017; Sarafian et al., 2018). As in prior models, we saw abundant indications for mantle upwellings or plumes as well as a pattern of lower velocities at shallow upper mantle depths in the northern EARS and higher velocities at shallow depths in the southern EARS. However, in our results, the patterns of low-velocities at middle upper mantle depths were laterally discontinuous along the full length of the EARS, and we imaged variable lithospheric topography that may influence the shallow flow of mantle upwellings.
Segmented upwellings beneath East Africa
Beneath the EARS, we imaged low-velocities at mantle transition zone (MTZ) depths, but at middle upper mantle depths, we imaged persistent patterns of separation between low-velocity features. While we have confidence in the pattern of separation within the upper mantle, we cannot resolve small features at deep depths and therefore cannot be certain whether the separation at shallower depths continues into the MTZ. At the shallowest upper mantle depths, the low-velocities appear to be overall more connected than at the middle upper mantle and are located mostly beneath the rift axis. In many regions, at shallow and middle upper mantle depths, the low-velocity anomalies are located adjacent to or between high-velocity features.
This pattern provides an overall sense that distinct buoyant upwellings, presumably of a thermal or thermochemical nature, are rising through the upper mantle and that their paths are likely influenced at shallow depths by rigid, presumably lithospheric, structures. Ultimately, it appears that these upwellings are sourced from MTZ depths. Such a pattern of secondary upwellings could be sourced by a deeper, ponded anomaly at or beneath the mantle transition zone, as has been previously suggested for the EARS from seismic and geochemical observations (Kieffer et al., 2004; Furman et al., 2006; Bastow et al., 2008; Huerta et al., 2009; Mulibo and Nyblade, 2013; Civiero et al., 2015). This pattern of buoyant upper mantle upwellings appears to be occurring along much of the EARS, and also in some other regions of Africa, however we note that fewer upwellings were imaged beneath the less evolved southern and western segments. In our view, this may be due to the history of upwellings or to the generally thicker lithosphere in the south and west that may act to divert upwellings.
Complex upper mantle beneath Turkana
One region that is most suggestive of a complex upwelling and diversion process is beneath the Turkana and South Sudan region. Here, the upper mantle has been difficult to image due to a lack of broadband seismic instrumentation. The Turkana segment is part of the primary EARS focus site and is particularly unique with regards to other segments of the EARS, because of the broad, diffuse rifting pattern and history of previous rifting oblique to the current-day trend (Brune et al., 2017; Ebinger et al., 2017).
Beneath this region, the indication of a low-velocity anomaly at deep upper mantle and mantle transition zone depths was most prominent (Fig. 3c). Directly above this, at middle upper mantle depths, a high-velocity feature was identified in the west beneath South Sudan, and the lowest velocities at these depths were located immediately adjacent to the high-velocity feature, to the north and to the southeast and southwest (Fig. 3b). Above this, at the shallowest upper mantle depths, the lowest velocities were imaged to the east beneath Lake Turkana. At these shallowest depths to the west beneath South Sudan, slightly slow to average upper mantle velocity was observed, while the fastest structure was located to the south and southwest beneath the laterally continuous Uganda and Bomu-Kibalan Cratons (Fig. 3a).
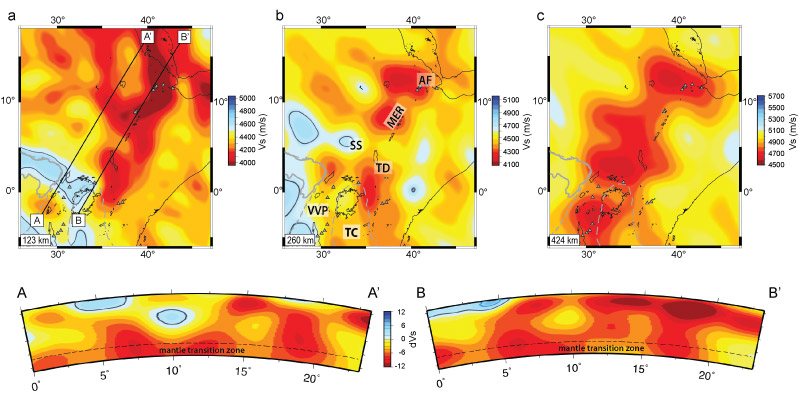
Figure 3. Three depth slices from the Turkana-South Sudan and Ethiopian Plateau regions showing shear velocity at a) 123 km, b) 260 km, and c) 424 km, modified from Emry et al. (2019). Cross-sections correspond to lines plotted on a. Abbreviations explained in Figure 1.
This pattern may suggest that rising asthenosphere is being diverted north and south around a lithospheric structure within the middle upper mantle beneath South Sudan. However, it is difficult to be certain of the spatial relationship and possible connection between this high-velocity feature and the Uganda and Bomu-Kibalan Cratonic roots located at shallower depths to the south and southwest. At this this point we can only speculate whether the structure is part of a stable, deep lithospheric root or whether it is sinking or foundering lithosphere (see discussion in Emry et al., 2019). However, we expect that this feature may affect the style of rifting, patterns of magma-rich vs. magma-poor extension, and connections between the Main Ethiopian Rift and the Eastern and Western Branches.
Summary
Overall, the EARS shows variability in lithospheric topography and reveals regions where the lithospheric structure may be affecting the path of upwellings at shallow and middle-upper mantle depths. However, there is also a clear sense of distinct upwellings within the upper mantle that might be sourced from a common, deeper anomaly. Our results of the upper mantle and mantle transition zone are useful in understanding the spatial relationships and possible connections between different segments and we hope that they will aid the overall goal of synthesis.
Acknowledgments

")
We thank the NSF Earth Sciences Postdoctoral Fellowship program for supporting this research (EAR-1349684). The shear velocity model from Emry et al. (2019) is available through the IRIS-EMC and through the GeoMapApp tool. We thank Manochehr Bahavar from the IRIS-EMC and Andrew Goodwillie from IEDA-GeoMapApp for helping to format the model and make it available.
Because our data came from ambient seismic noise, it was necessary that stations had temporally overlapping records. In this regard, the sparsely distributed long-term seismic deployments, such as the GSN, GEOSCOPE, AfricaArray (see photos), and MedNet were irreplaceable, and allowed us to also incorporate several 1-2 year (‘PASSCAL-type’) seismic deployments throughout Africa and the surrounding regions. ■
Reference information