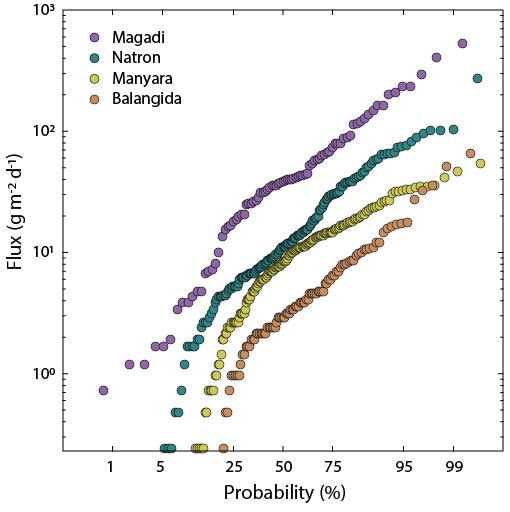
Figure 3. Probability plots of diffuse soil CO2 fluxes for each rift basin in the study. Note that the overall CO2 flux values decrease from north (Magadi) to south (Balangida). Flux values below the equipment detection limit (<0.24 g m-2 d-1) cannot be presented on the plots, but still affect the probability distribution of flux values above the detection limit.