Carl W Ulberg1 and the iMUSH Team*
*The iMUSH team includes Geoffrey A Abers2, Olivier Bachmann3, Paul Bedrosian4, Dawnika L Blatter4, Esteban Bowles-Martinez5, Michael A Clynne⁴, Kenneth C Creager1, Kayla Crosbie2, Roger P Denlinger⁴, Margaret E Glasgow⁶, Jiangang Han1, Steven M Hansen⁶, Graham J Hill⁷, Eric Kiser⁸, Alan Levander⁹, Michael Mann2, Xiaofeng Meng1, Seth C Moran⁴, Jared Peacock⁴, Brandon Schmandt⁶, Adam Schultz⁵, Thomas W Sisson⁴, Roque A Soto Castaneda2, Weston A Thelen⁴, John E Vidale1, Maren Wanke3
1University of Washington, 2Cornell University, 3ETH-Zurich, ⁴USGS, ⁵Oregon State University, ⁶University of New Mexico, ⁷University of Canterbury, ⁸University of Arizona, ⁹Rice University
iMUSH is funded by NSF-GeoPRISMS, NSF-Earthscope with substantial in-kind support from the USGS.
The imaging Magma Under Mount St. Helens (iMUSH) experiment aims to illuminate the magmatic system beneath Mount St. Helens (MSH) from the subducting Juan de Fuca Plate to the surface using multiple geophysical and petrologic techniques. Field work involved seventy broadband seismometers deployed from 2014 to 2016, 23 active shots set off in the summer of 2014 recorded at about 5000 sites with Texan instruments and 950 additional Nodal stations, 150 new magnetotelluric measurements, and new petrologic sampling and analysis (Fig. 1).
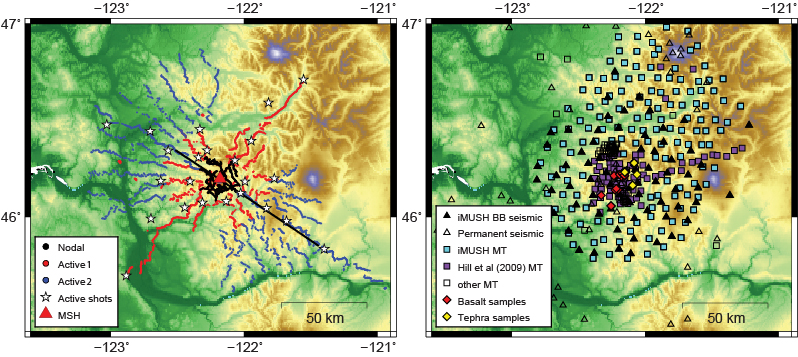
Figure 1. Left: Map of the active source deployment. In the summer of 2014, 23 shots were recorded by about 2500 Texan seismometers installed in two deployments, in addition to 950 Nodal seismometers. The black line shows the location of cross-sections in Figure 2. Right: Locations of permanent and temporary broadband seismometers used in the passive source experiment, magnetotelluric sites, and petrologic samples.
In June 2017, about twenty iMUSH scientists met at the USGS Cascades Volcano Observatory in Vancouver, WA, to discuss emerging iMUSH results and to integrate those results into a consistent model of the crust and upper mantle under Mount St. Helens. Some results have been published already and many more are on their way to publication.
Passive seismic techniques include local earthquake tomography, ambient noise tomography, receiver function imaging, attenuation tomography, and SKS anisotropy. Using these techniques, we can image portions of the crust and mantle from the subducting slab to the surface, at varying degrees of resolution. Principal investigators for this portion of the experiment are Ken Creager, Geoff Abers, and Seth Moran, plus several students mentioned below.
Local earthquake tomography imaging is limited to the upper 20 km of the crust. Using more than 10000 first arrival picks for P- and S-waves from 400 local earthquakes, Carl Ulberg imaged surface-mapped features such as several high-velocity Miocene plutons, and the low-velocity Indian Heaven volcanic field and Chehalis sedimentary basin. Deeper features include the low-velocity Mount St. Helens seismic zone (SHZ), and low velocities at depths of 6-15 km below sea level beneath MSH, possibly related to a shallow magma storage region that has been identified previously with seismic studies and constrained by petrology (Fig. 3; Scandone and Malone, 1985; Lees and Crosson, 1989; Waite and Moran, 2009).
Ambient noise tomography involves cross-correlating the seismic noise between all of the station pairs in the array, and inverting the phase velocity maps to obtain a 3-D shear wave model of the crust and upper mantle. Using this technique, Kayla Crosbie found a general trend of high velocities in the lower crust to the west of MSH, and lower velocities to the east. This could be related to the presence of the accreted Siletz terrane (oceanic basalt from ~50Ma) to the west, and/or high temperatures and partial melt in the lower crust to the east (Fig. 2).
Receiver functions record the arrival of reflected and converted waves from teleseismic earthquakes. This technique is useful for locating interfaces with strong velocity discontinuities, since these reflect waves efficiently. Using this technique, Michael Mann imaged the subducting Juan de Fuca slab at a depth of ~70 km beneath MSH, and ~100 km beneath Mount Adams, almost 50 km to the east. Roque Soto used teleseismic attenuation tomography to model attenuation in the area around MSH. Abe Wallace and Erin Wirth used shear wave splitting of SKS phases to infer a fast direction of anisotropy aligned NE-SW, consistent with regional trends.
The active source experiment has yielded several results including 2-D Vp and Vs profiles through MSH down to the Moho, a map of the reflectivity of the Moho beneath MSH, and details of the locations and characteristics of seismic sources beneath MSH.
Using thousands of observations of the 23 active shots, Eric Kiser and Alan Levander obtained 2-D seismic velocity profiles through MSH (Kiser et al, 2016), and are working on a 3-D inversion of the same data.
The model includes a low-velocity zone in the lower crust 10-20 km SE of MSH, hypothesized to be a potential magma storage region as magma makes its way from the mantle to be erupted at MSH. This low-Vp zone corresponds spatially with the low-Vs zone imaged with ambient noise tomography (Fig. 2). High Vp/Vs regions in the upper crust beneath MSH and Indian Heaven could correspond to areas with partial melt, at active Holocene eruptive centers. The 3-D active source seismic imaging reveals similar features in the upper 15-20 km as imaged by the local earthquake tomography (plutons, sediments, etc.).
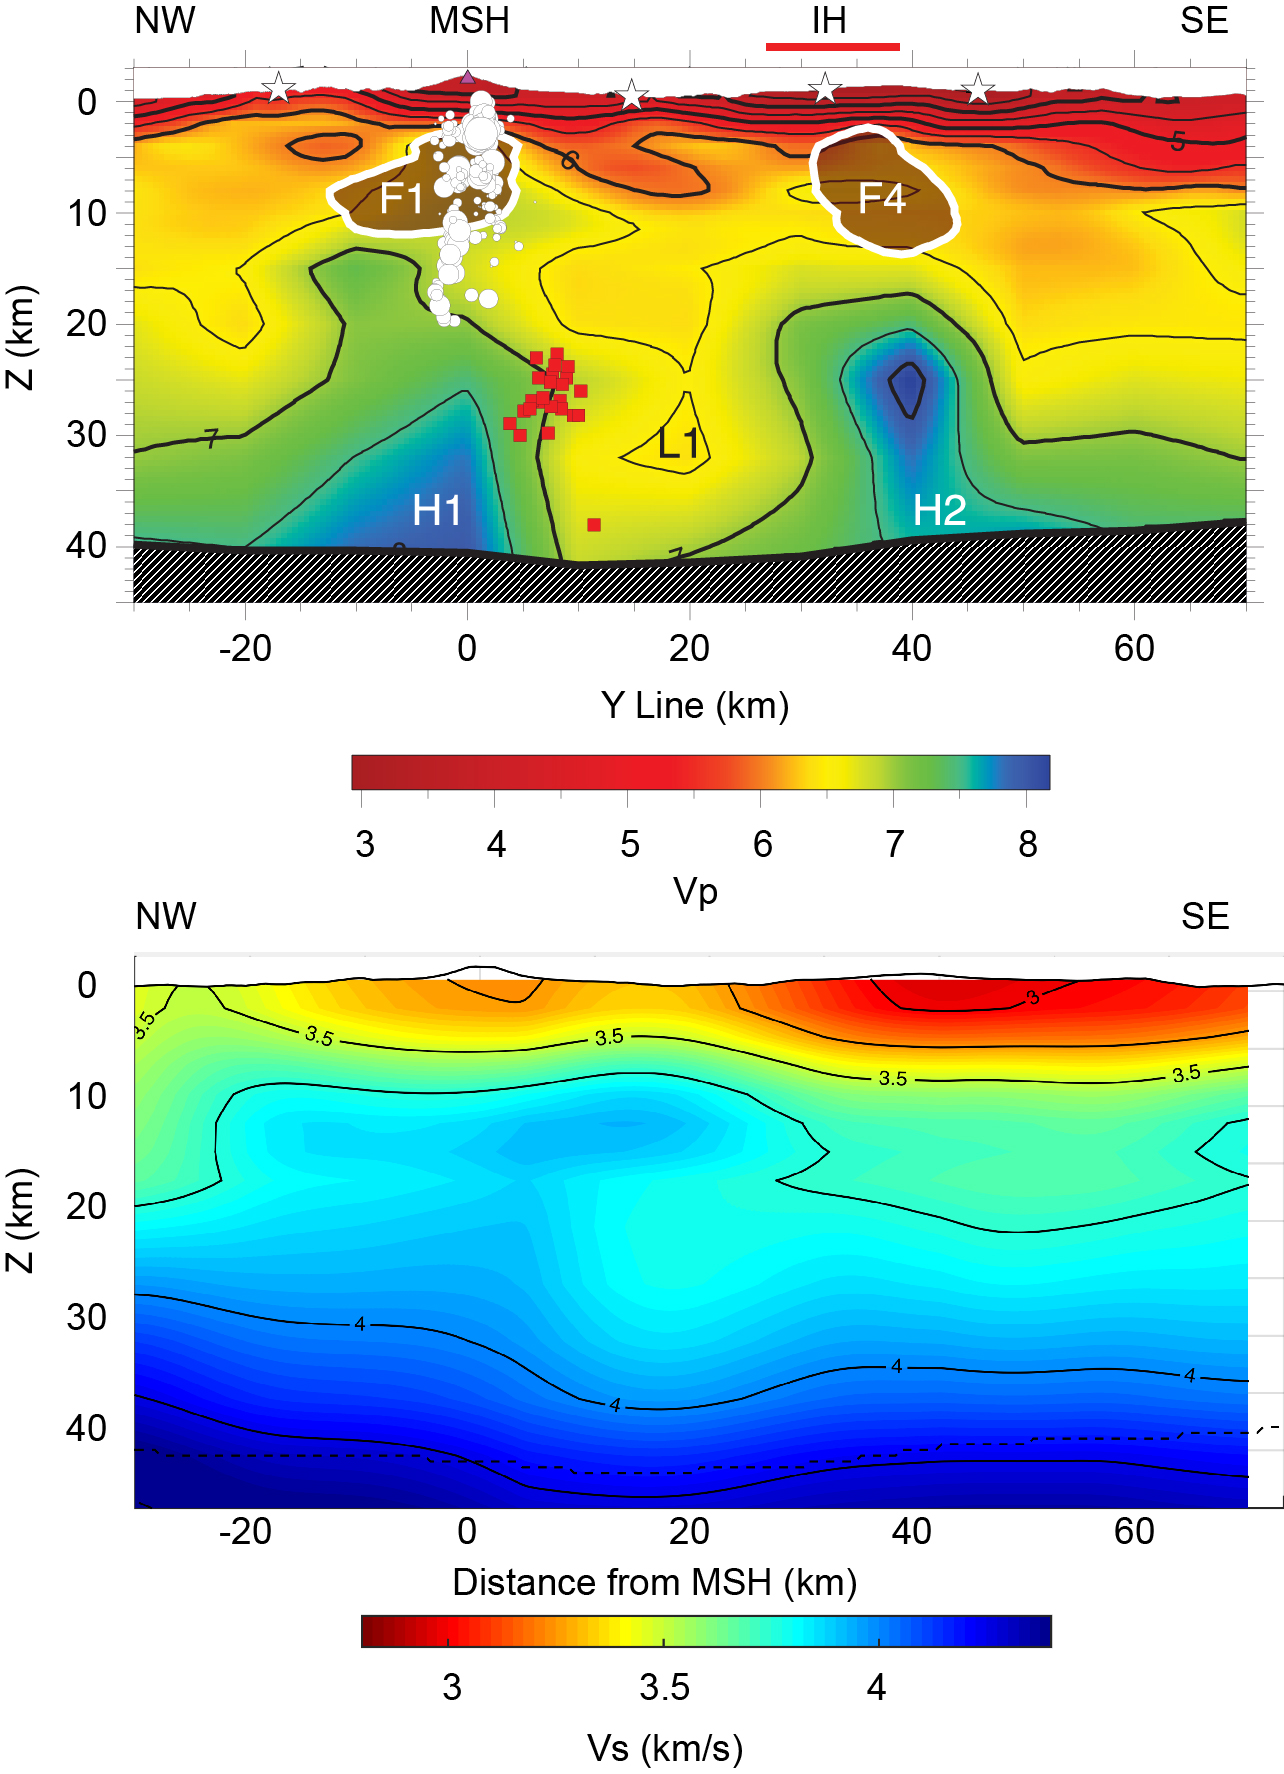
Figure 2. Top: NW-SE cross-section through MSH and the Indian Heaven volcanic field (IH) from Kiser et al (2016), showing high Vp (H1, H2), low Vp (L1) and high Vp/Vs anomalies (F1, F4). White dots are earthquakes during the first 24 h following the 18 May 1980 eruption, red squares are deep long-period event locations since 1980, white stars are active shot locations. Bottom: Cross-section along the same NW-SE line through the ambient noise tomography Vs model. High and low velocities in the lower crust are in similar locations as the active source model. The dotted line is the location of the Moho in the upper panel.
During the active source experiment, 950 Nodal stations were deployed for two weeks on and around the edifice of MSH. Steve Hansen and Brandon Schmandt stacked these data to reveal details of the reflectivity of the Moho, the boundary at the base of the continental crust (Hansen et al, 2016). They found large amplitude reflected waves to the east of MSH but little evidence for reflected waves to the west. This indicates that there is a stronger velocity contrast between the lower crust and upper mantle to the east of MSH than to the west. This could be related to the presence of a serpentinized mantle wedge, which would lower the velocity of the upper mantle. Due to its lower temperature, this probably also precludes the possibility of magma derived from the mantle wedge directly beneath MSH. Instead, it would have to come from somewhere to the east, an idea also supported by the active seismic and noise cross-correlation results.
Using the dense instrumentation on and around MSH, seismic sources can be better-characterized as well. Deep long-period earthquakes have been observed beneath MSH since sufficient instrumentation was installed around the time of the 1980 eruption. Using cross-correlation techniques, Jiangang Han determined that almost all of these events actually occurred in the same place, a location ~5-10 km SE of MSH at a depth of 22-30 km below sea level. Margaret Glasgow, Hansen, and Schmandt worked with the Nodal data to locate and characterize an order of magnitude more shallow events than were in the Pacific Northwest Seismic Network catalog. Xiaofeng Meng and John Vidale obtained a high-resolution set of seismic locations within 5-km depth of MSH with double-difference relocations using accurate 3-D velocity models.
The iMUSH magnetotelluric experiment, led by Adam Schultz (OSU) and Paul Bedrosian (USGS), collected data at 150 sites within the broad area encompassing Mounts St. Helens, Rainier, and Adams. These data were supplemented by a denser set of data collected ~10 years previously in the immediate area around MSH (Hill et al, 2009). A primary aim of the magnetotelluric study is to obtain a more detailed image of what has been termed the Southwest Washington Cascades Conductor (Stanley et al, 1987). Three-dimensional resistivity modeling by Jared Peacock, Esteban Bowles-Martinez, Bedrosian and Schultz imaged a ring of high conductivity extending NNW from MSH, east under the Cowlitz River, south along the western edge of the Cascades arc, and west beneath Indian Heaven.
Much of the high conductivity overlaps with low velocities imaged by seismic tomography (Fig. 3). The origin of the high conductivity is somewhat enigmatic. One theory is that the high-conductivity reflects contact metamorphism of Eocene marine sediments along the margins of a large Miocene intrusion, emplaced in or near the suture zone between the Siletz terrane and the Mesozoic North American margin. That Mount St. Helens sits directly atop this conductive ring may shed light on both its unusual forearc location and predominantly dacitic composition. A more subtle conductor imaged within the lower-crust may be related to a small degree of partial melt which may in turn source surface volcanism.
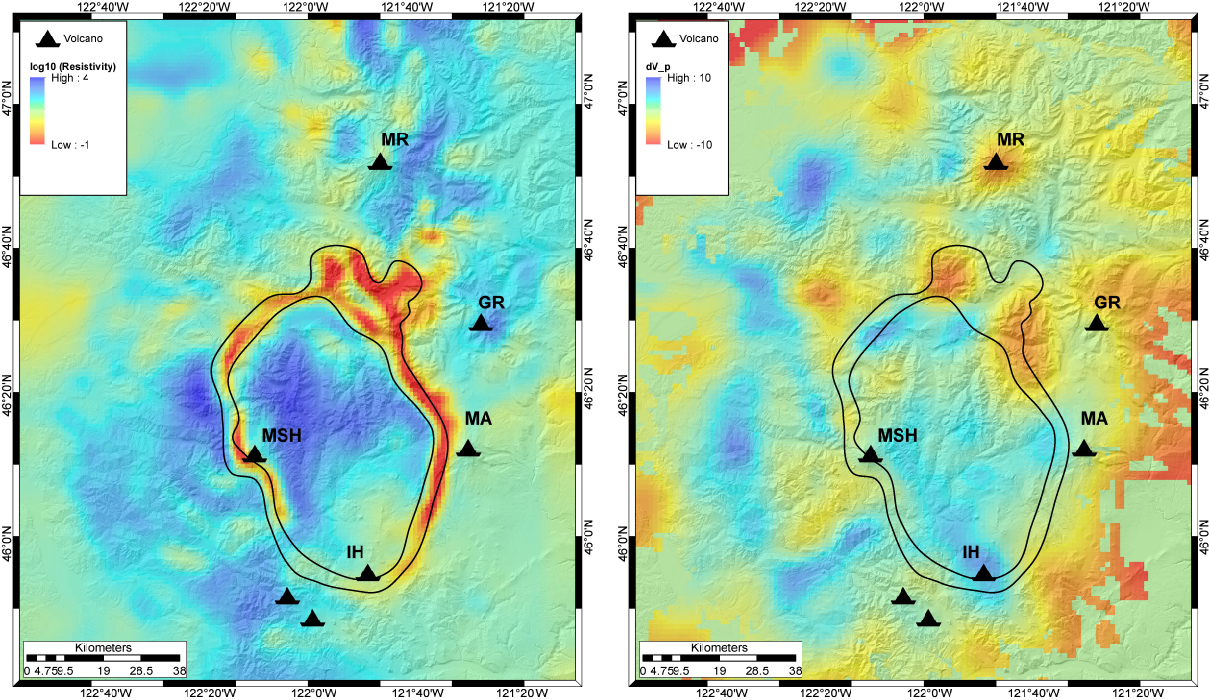
Figure 3. Left: Magnetotelluric model at 7km depth, showing details of high conductivities between MSH, Mount Rainier and Mount Adams (black outline). Scale is log10 (resistivity), so red areas are highly conductive. Triangles are volcanoes. Right: Local earthquake tomography Vp model at the same depth, showing percent variation from a 1-D average velocity model, masked for areas without raypaths. Several low-Vp anomalies coincide spatially with high conductivities in the MT model (black outline shows high conductivity).
Petrologic studies conducted on rocks collected near MSH have revealed several new insights into the magmatic system. Three mafic endmembers are encountered at MSH: high-K basalts (Type 1), low-K basalts (Type 2), and arc-type basaltic andesites (Type 3). The distinct geochemical characteristics of each mafic type require variable contributions of flux and decompression melts, involving different sources in the mantle, possibly including asthenospheric upwelling through a slab tear or gap beneath northern Oregon (Obrebski et al, 2010). The preservation of their mantle signatures requires separate ascent pathways through the crust (likely along re-activated fractures) for distinct batches of basalt aside from the main plumbing system. Further, petrographic observations made by Maren Wanke, Olivier Bachmann, and Michael Clynne indicate frequent mixing of some basalt types with the silicic upper part of the system, producing magmatic cycles of basalt entraining a dacitic magma reservoir, mixing, fractionating and erupting the diverse magmas of the Castle Creek period (~1900-1700 years B.P.). However, dacites are the most abundant rock type at MSH and the eruption of basalt remains a rarity. Hydrous arc-type basaltic andesite (Type 3), presumably the most abundant type of mafic magma produced in the mantle, is likely feeding the main magmatic plumbing system to form dacites in a lower crustal mush zone, which is possibly being imaged by the active source, ambient noise, and magnetotelluric studies.
Two voluminous dacitic tephra units from MSH over the last 4 ka were also sampled and studied using near-liquidus, fO2-buffered inverse experiments over a range of pressures, temperatures and H2O concentrations (Blatter et al, 2017).
The results of these experiments indicate that the dacite liquid is generated at deep crustal pressures (700-900 MPa, ~20-35 km) and moderate temperatures (925°C), with high H2O concentrations (6-7 wt%) and high fO2 (~NNO+1.3). Mass balance calculations using the mineral and liquid compositions from the experiments indicate that crystallization of an H2O-rich basaltic andesite (similar to Type 3), or re-melting a vapor-charged hornblende gabbro can generate large quantities (~35 wt%) of hydrous dacite, implying that regular recharge of the system by H2O-rich basalts, basaltic andesites, or vapor is necessary for the persistent production of dacitic melt consistent with the eruptive history of MSH.
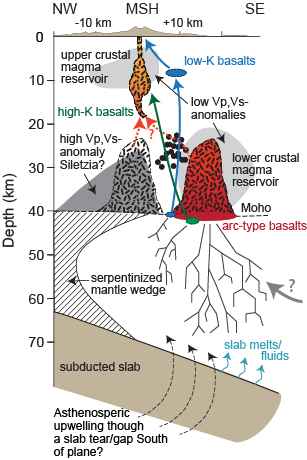
Figure 4. Schematic cross-section through the crust and mantle beneath MSH including a lower and upper crustal magma reservoir (dashed lines) inferred from low P-wave (Vp), S-wave (Vs) velocity anomalies (shaded areas) (Kiser et al., 2016) and the position of deep long period earthquakes (black dots). The outline of the upper crustal magma reservoir is inferred from earthquake locations of the 1980 eruptions (Scandone and Malone, 1985). Colored arrows indicate separate pathways through the crust for the different mafic endmembers: high-K basalts, low-K basalts and arc-type basaltic andesites. The serpentinized mantle wedge is inferred from seismic data of Hansen et al. (2016). Figure provided by Maren Wanke.
Several features are consistently observed in geophysical surveys and match inferences from petrological clues (Fig. 4). Local and active source tomography, place an anomalous region in the upper crust at depths of 5-15 km below sea level beneath MSH. The likely explanation for this is an upper crustal storage region for evolved magma, some of which will likely erupt at MSH in the future. In the lower crust, ambient noise tomography and reflected waves from active source tomography point towards a low-velocity region to the east or SE of MSH, which could be related to lower crustal magma storage. Magnetotelluric results are also consistent with a small degree of lower-crustal partial melt, although the spatial extent of such melt is not in complete accordance with that inferred from seismic tomography. Since MSH is located anomalously trenchward for a Cascades volcano, with a slab depth of ~70 km directly beneath MSH, an offset magma pathway is possible. Deep long-period earthquakes may indicate the presence of magmatic fluid along this pathway. Low velocities and high conductivity are observed along the SHZ, which could be related to higher temperatures and fractured rock, fluids, and/or the presence of metasedimentary rocks within the Eocene Siletz suture zone. Upper crustal features are also consistent across local, active source, and ambient noise tomography, giving us a better idea of the upper crustal structure of the region, including multiple Miocene-aged plutons and sedimentary basins. ■
Reference information
