Samer Naif1, Kerry Key1, Steven Constable1, Rob L. Evans2
1SCRIPPS Institution of Oceanography, 2Woods Hole Oceanographic Institute
Modified from Naif, S., Key, K., Constable, S., Evans, R.L., 2013. Melt-rich channel observed at the lithosphere-asthenosphere boundary. Nature 495, 356-359.
In April and May 2010, we conducted the Serpentinite, Extension and Regional Porosity Experiment across the Nicaraguan Trench (SERPENT). During the 28 day cruise on the R/V Melville we collected seafloor electromagnetic data sensitive to electrical conductivity variations in the crust and mantle. Because electrical conductivity depends on pore fluid content, the data from SERPENT provide unique constraints on porosity across an active subduction zone. The entire SERPENT data set consists of 54 stations of marine magnetotelluric (MT) data and nearly 800 km of deep-towed controlled-source electromagnetic (CSEM) data. This is a huge milestone for marine electromagnetic (EM) studies as we collected significantly more seafloor MT stations than previous offshore surveys of subduction zones. Furthermore, our survey is the first to collect marine CSEM data at a subduction zone. The results showed here demonstrate the ability to image porosity and pore fluids in crustal bending faults and along the plate interface beneath the forearc using this technique.
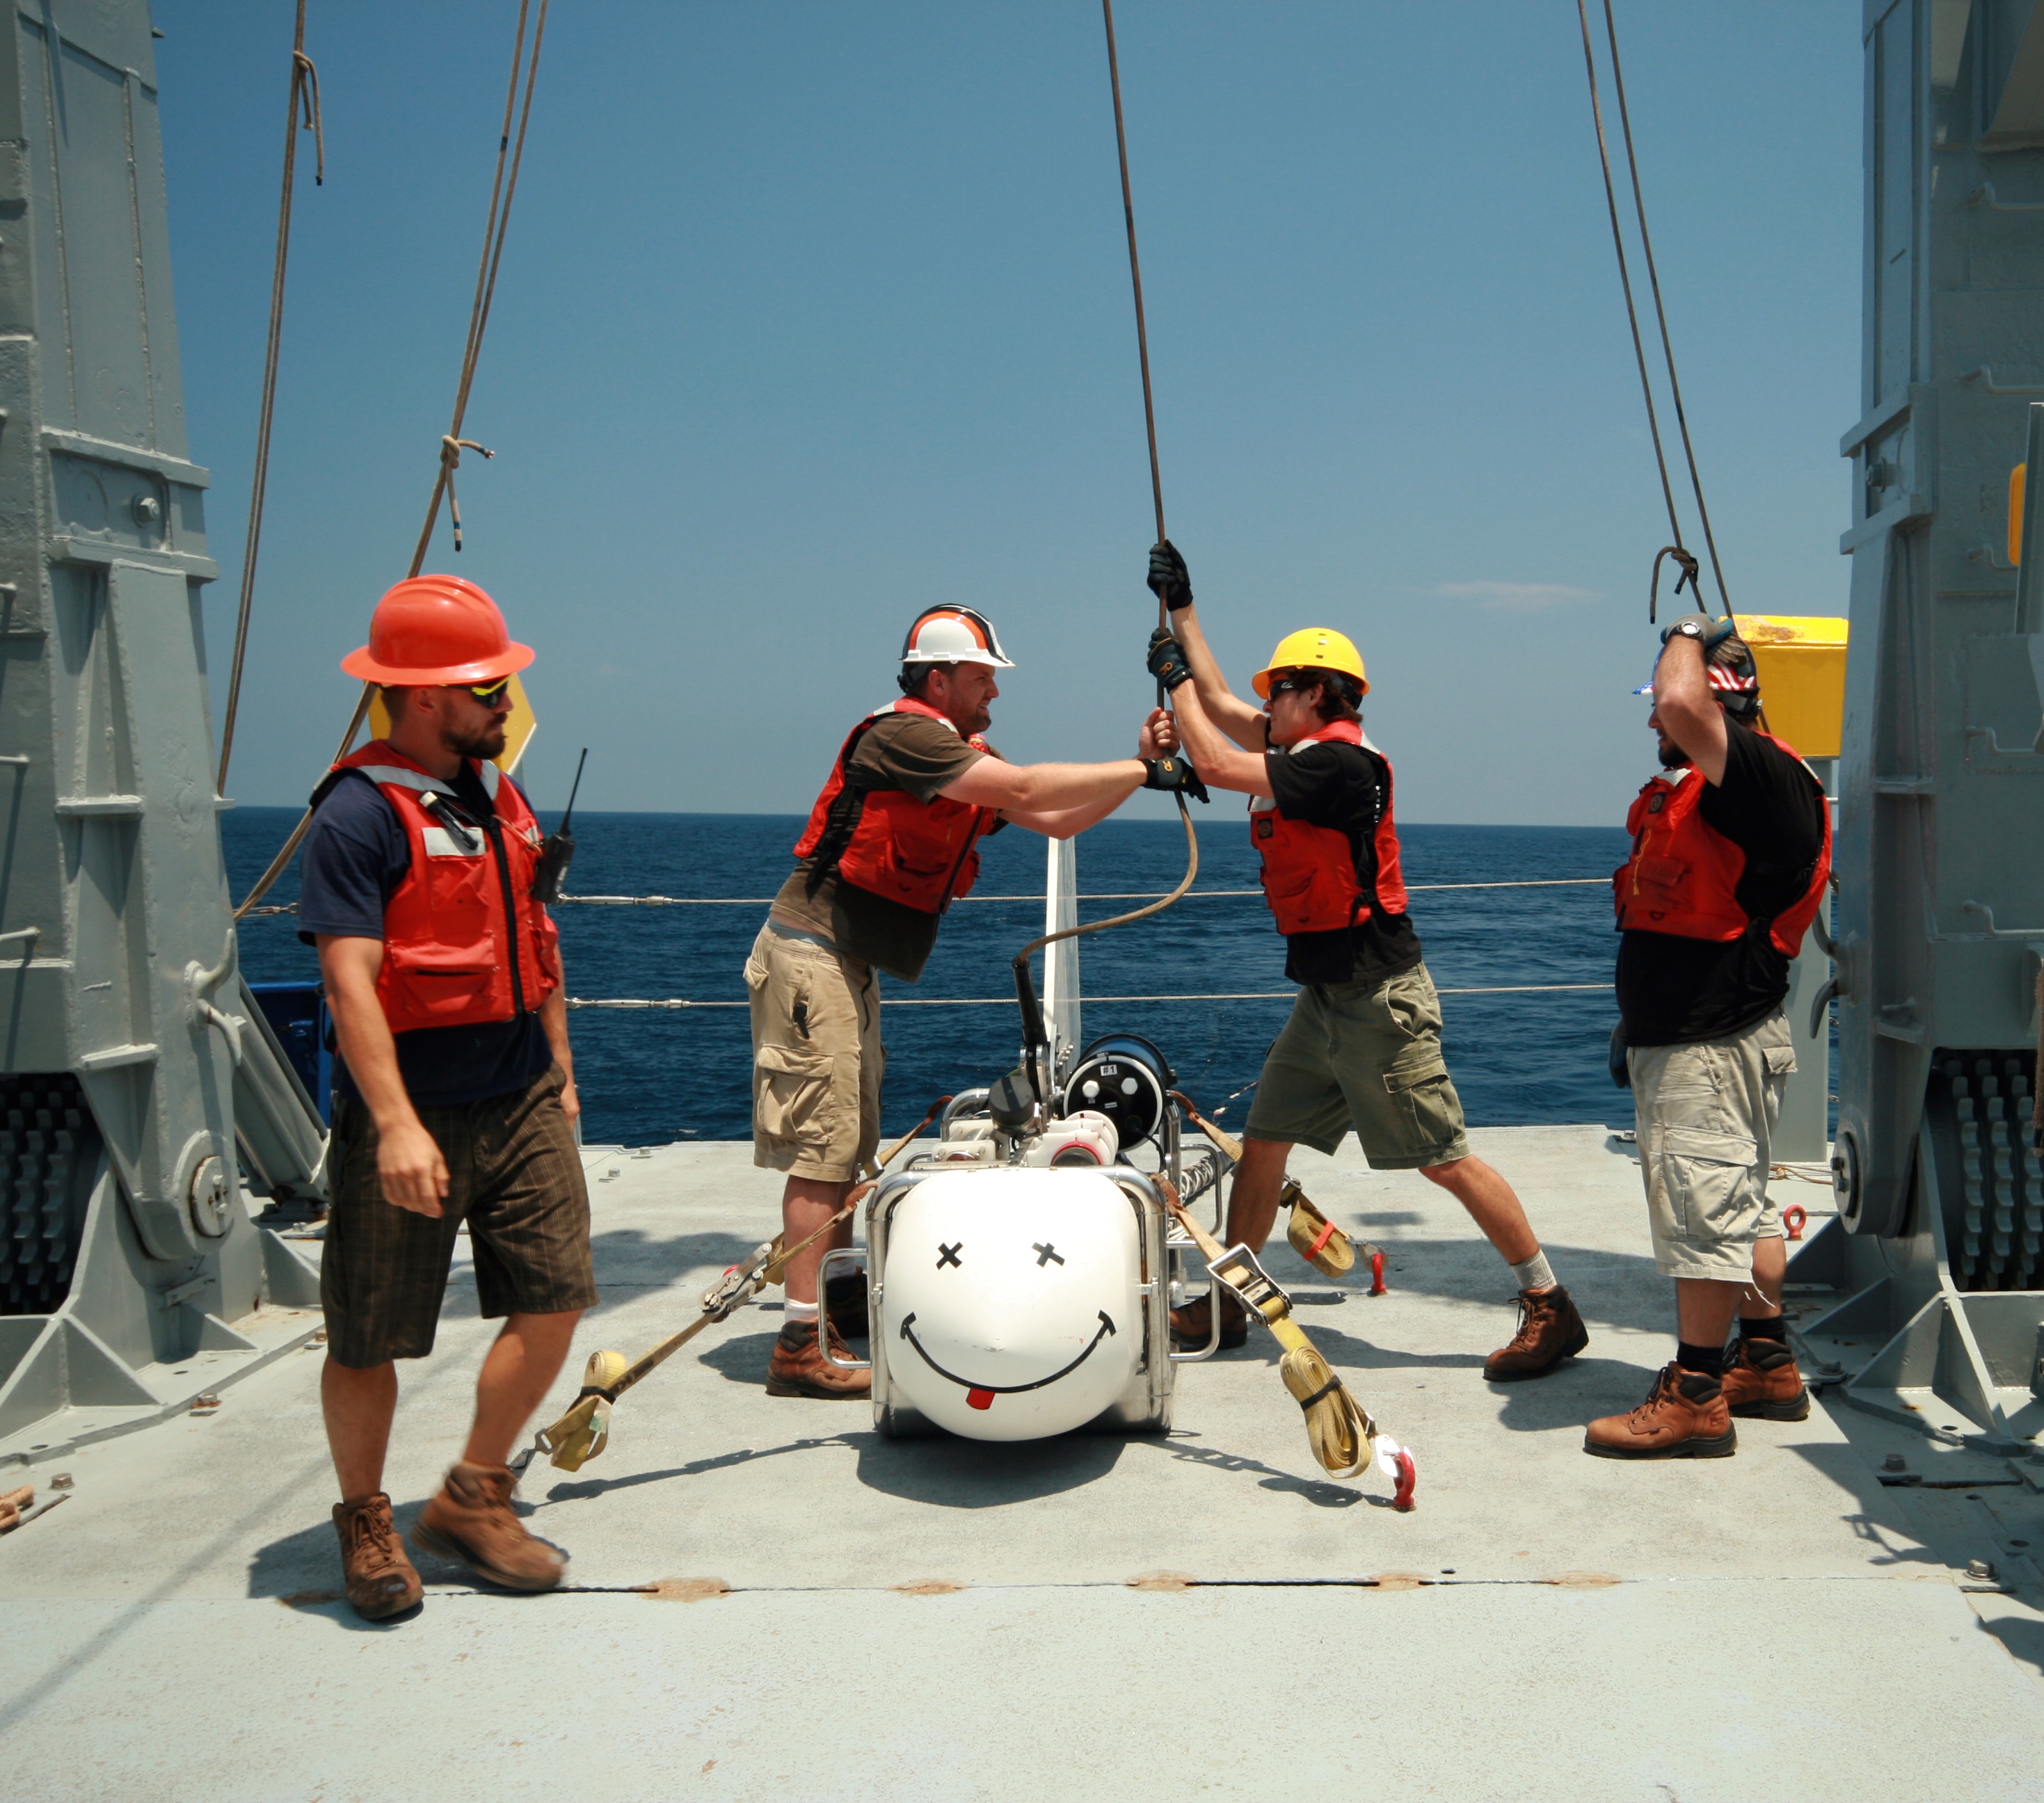
SERPENT team members deploy the Scripps Undersea EM Source Instrument (SUESI), a deep-towed horizontal electric dipole transmitter used for the CSEM method. SUESI will only work if she is smiling.
Electrical conductivity is a material property that can vary by several orders of magnitude in geologic systems. While metallic ore bodies can be very conductive, the silicate rocks that dominate the crust and upper mantle are relatively poor conductors (<10-5 S/m). However, fluids such as seawater and basaltic melt are significantly more conductive (>10-1 S/m). Given this large contrast, even small amounts of conductive pore fluids in an otherwise resistive matrix can produce a notable increase in bulk electrical conductivity, making a suitable target for EM exploration.
Electrical and electromagnetic (EM) methods have been used for onshore prospecting for about a century. Their use offshore came later with pioneering efforts at the Scripps Institution of Oceanography, where an ocean-bottom EM recorder was developed in the 1960’s , followed by the development of a deep-towed EM transmitter system in the 1970’s and 1980’s to map the high resistivity of the oceanic lithosphere (Constable, 2013). While this early work was largely funded by the Office of Naval Research, the recognition that this technology could be used to map resistive hydrocarbon reservoirs on the continental shelves led to a significant influx of industry support starting around 2000, resulting in major strides in instrumentation design, numerical modeling algorithms, and data interpretation tools. In particular, industry support allowed Scripps to develop a fleet of 60 broadband ocean-bottom EM receivers and two deep-towed EM transmitter systems. We leveraged this equipment for the NSF-funded SERPENT project, resulting in the largest marine EM experiment at a subduction zone to date.
MT passive method utilizes a natural source field generated by the interaction of the solar wind with the geomagnetic field. This interaction leads to the formation of time varying ionospheric current systems that emanate plane EM waves diffusing down to the surface through the resistive atmosphere. As these EM fields diffuse into the solid Earth, they attenuate in response to the subsurface conductivity structure. By measuring both electric and magnetic fields on the seafloor for several days to weeks, the MT method can estimate frequency dependent impedances over several decades of frequency, which in turn can be inverted for conductivity structure. In marine environments, the highly conductive ocean attenuates the source energy at frequencies above about 0.1 Hz, reducing the sensitivity of marine MT to shallow structure and making it more suitable for recovering upper mantle conductivity structure. In order to better resolve structure in the upper 10 km, we can supplement the MT method with the CSEM method, which involves deep towing a transmitter that emits 300 amps of time varying current across a 250 m dipole antenna, giving EM responses in the 0.25 to 10 Hz band (Fig. 1).
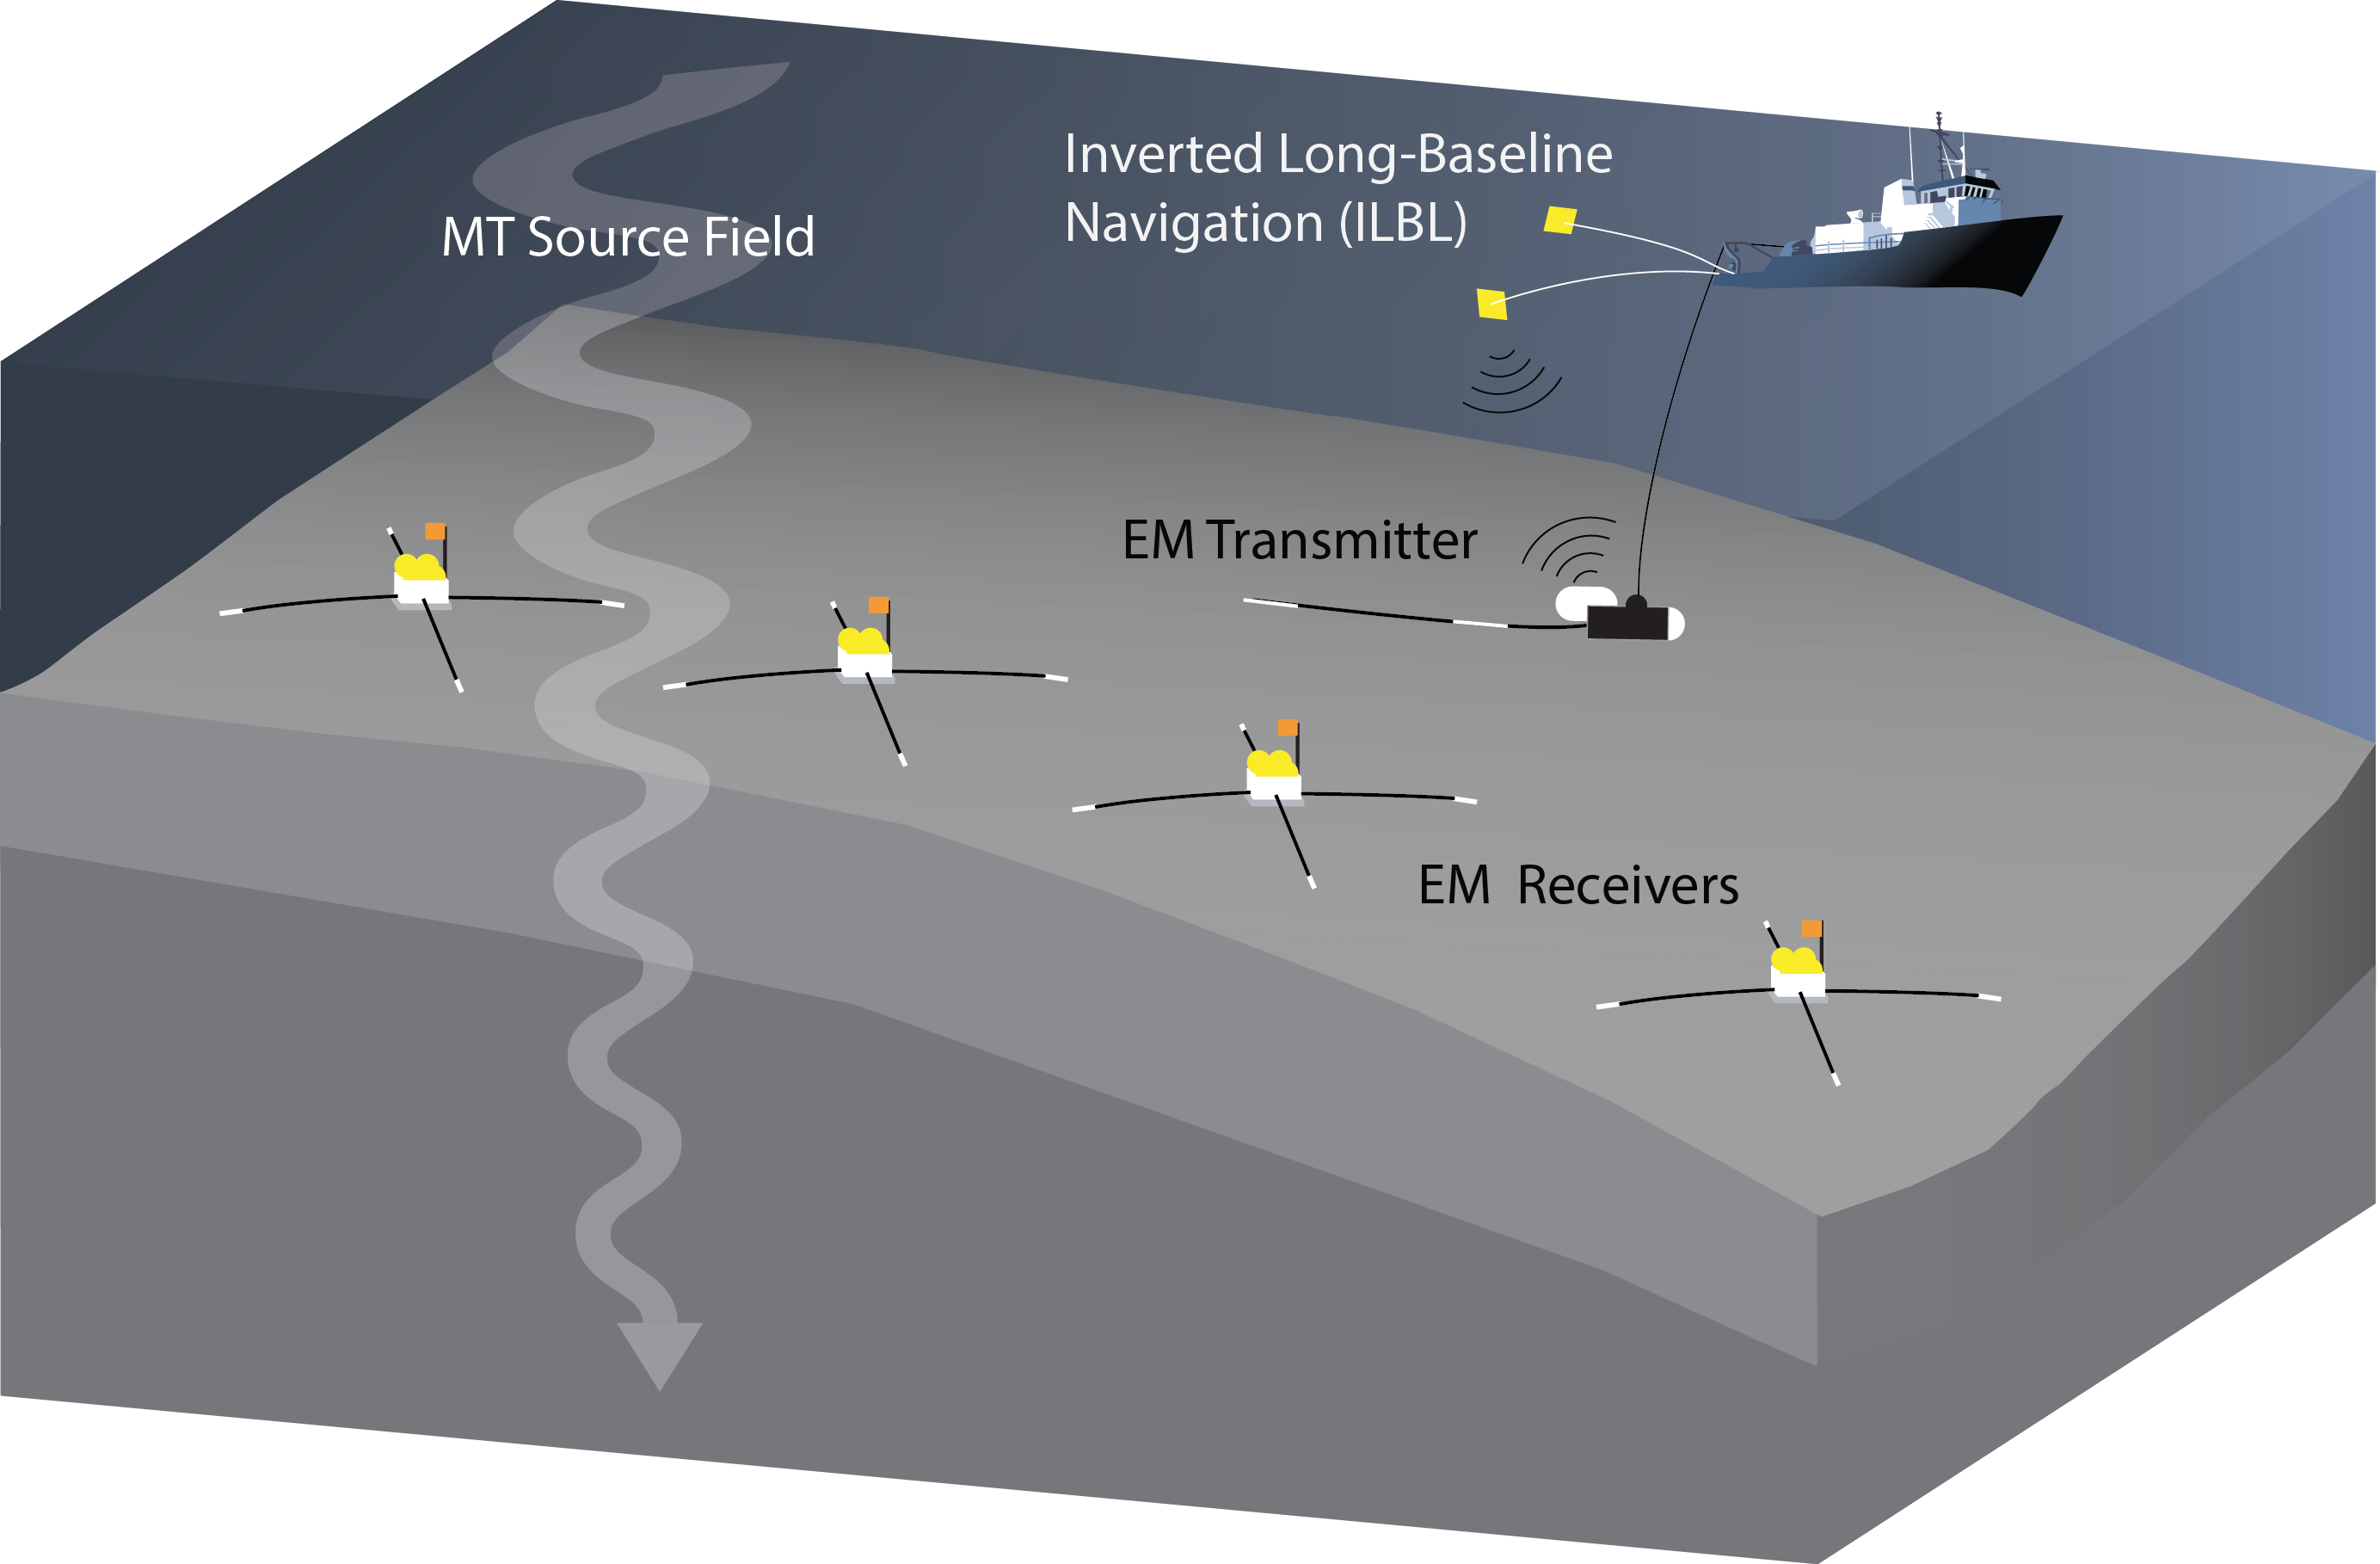
Figure 1. Marine EM survey operations. Broadband EM receivers are deployed from the ship to record electric and magnetic fields generated by both active and passive sources. An EM transmitter, deep-towed behind the ship near the seafloor, emits the high-frequency active source energy. The transmitter position is acoustically navigated with an inverted long-baseline configuration. A large-scale survey spanning several hundred kms can be performed in a single month long cruise voyage.
The SERPENT survey was conducted along a 280-km transect crossing the Middle America Trench offshore Nicaragua (Fig. 2). Previous seismic imaging detected deep Moho-crossing bending faults that could provide pathways for water to serpentinize the uppermost mantle (Ranero et al., 2003). We collected marine MT and CSEM data in order to probe the subsurface electrical conductivity structure for anomalies associated with fluid-tectonic processes at the subduction front, such as plate hydration beneath the outer rise bending faults as well as diagenetic dehydration of the subducted sediments. Our goal was to quantify the lateral and depth variations of porosity in the incoming oceanic plate and the forearc margin so that we could infer fluid content and identify migration pathways and circulation patterns.
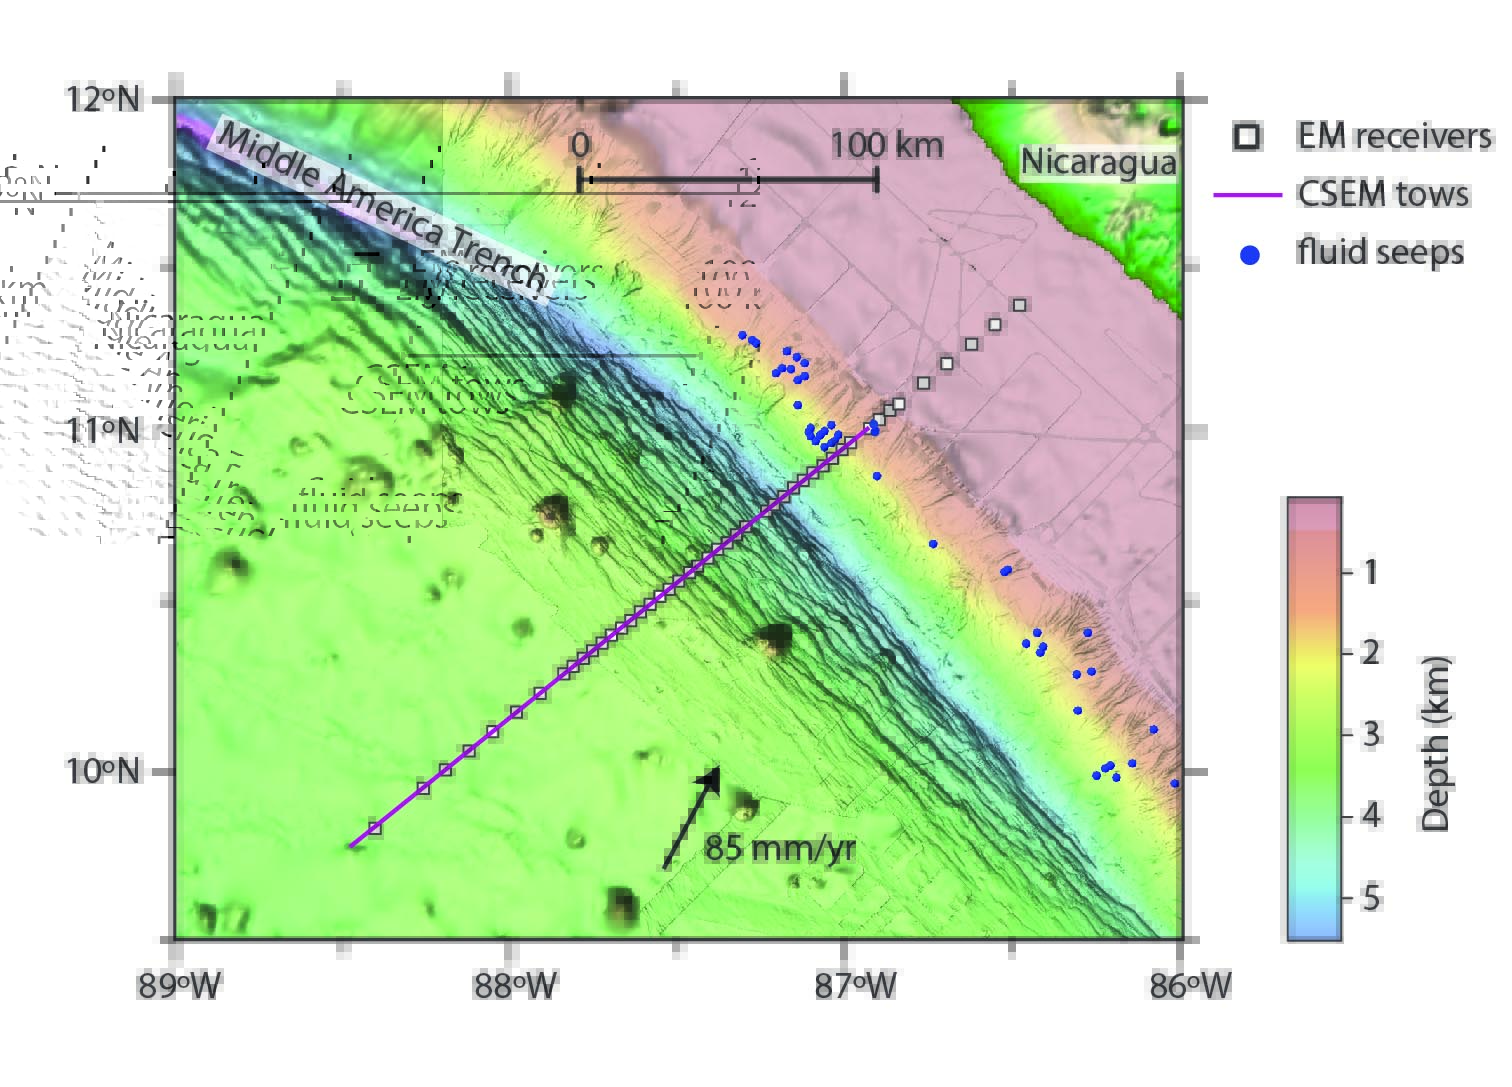
Figure 2. Map of the SERPENT survey transect. A total of 50 EM receivers were deployed across the Middle America Trench offshore Nicaragua, where the 24 Ma Cocos plate subducts beneath the Caribbean plate. Receiver locations spanned the abyssal plain, the visibly faulted outer rise, and the continental slope and shelf at 10 and 4 km spacing. A cluster of active forearc seeps are located adjacent to the survey transect (blue circles).
We specifically designed the survey transect to include data coverage over the Cocos plate abyssal plain, far enough seaward of the outer rise so we would image what was expected to be a simple one-dimensional conductivity structure of “normal” oceanic mantle. This measure was meant to serve as a background measurement of the oceanic lithosphere from which we could better quantify conductivity changes associated with faulting and hydration at the deformation front. With a stroke of luck, the MT data from the abyssal sites were far more valuable than we predicted, aiding our discovery of a surprising horizontally extensive high conductivity layer at depths of 45-70 km (Fig. 3). The observed layer led us to consider a fundamental question regarding plate tectonics that was unrelated to the originally proposed goals of the survey: what rheological mechanisms govern the lithosphere-asthenosphere boundary (LAB) allowing rigid tectonic plates to slide?
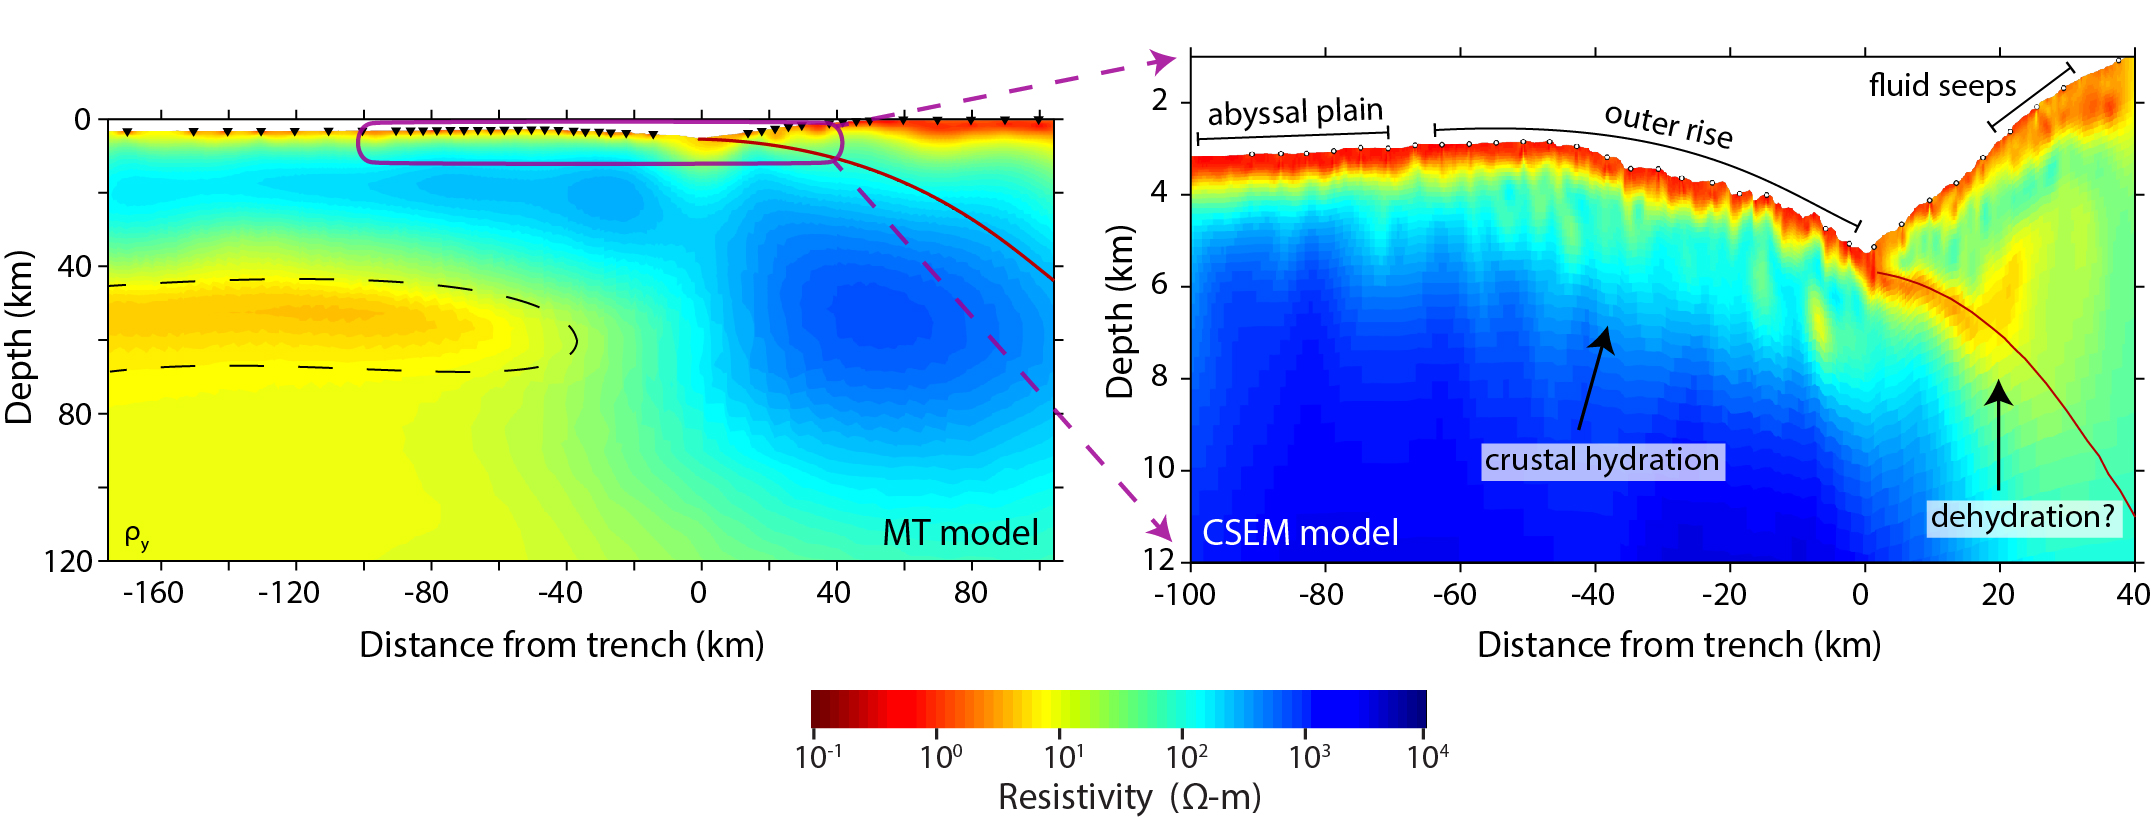
Figure 3. Non-linear 2D inversion of MT and CSEM data. Left: converged MT data inversion. The dashed black lines enclose the prominent low resistivity channel interpreted as partial melt at the LAB. Right: converged CSEM data inversion that shows decreasing resistivity beneath fault scarps at the outer rise and a low resistivity channel that follows the plate interface in the forearc margin, and which represent hydration and sediment subduction, respectively.
There are three competing hypotheses often invoked to explain the oceanic LAB that is prominent in seismic and EM observations: 1) a thermal boundary, 2) a hydration boundary, 3) a partial melt boundary (Fischer et al., 2010). From the existing laboratory studies of the electrical conductivity of expected mantle phases, the signature of our observed channel is too conductive to be explained with either temperature or hydrated olivine alone. Such high conductivity measurements require an interconnected network of 1-2% hydrated basaltic melt. Alternatively, a recent study suggests that 0.3-0.5% of highly enriched incipient melt is a more plausible interpretation (Sifré et al., 2014). In light of other recent results that infer or are compatible with partial melt at the LAB (Mierdel et al, 2007; Sakamaki et al., 2013; Yamamoto et al., 2014) it is tempting to conclude that partial melts are ubiquitous and the dominant cause of a rheologically weak asthenosphere. However, a number of competing interpretations derived from compelling observations continue to spark exciting debate regarding the origin of the asthenosphere (Karato, 2012; Beghein et al., 2014; and references therein).
While the MT results are enticing food for thought, we have yet to address our survey’s core objective, to investigate the hydration and dehydration of a subducting slab. This is where the potential of the CSEM method really shines. In the right panel of figure 3, we offer a glimpse of our 2D CSEM conductivity model, created by a non-linear two-dimensional inversion of the observed data (Naif et al., in review). This model depicts three important fluid-tectonic processes within the framework of a single coherent image:
At the outer rise, multiple sub-vertical conductive channels correlate with seafloor fault scarps that extend into the lower crust. This observation confirms previous conjecture that outer rise faults behave as porous permeable pathways for seawater to penetrate the plate and further suggests that significantly more crustal pore water is subducted than previously thought.
At the forearc, a thin conductive channel that persists along the plate-interface is caused by the complete subduction of porous sediments with the sinking oceanic plate. This observation suggests that a considerable amount of water is available to generate extreme pore pressures and is consistent with seismic observations and numerical models at the erosive Nicaraguan margin (Spinelli et al., 2006; Ranero et al., 2008; Saffer & Tobin, 2011).
Approximately 20 km into the margin, a prominent sub-vertical conductive channel propagates from the plate-interface into the overlying continental crust in the same region where numerous active seafloor seeps and mud mounds exist (Sahling et al., 2008). This is potentially the first observation to image the migration of subducted fluids to forearc vents.
The outcomes of the SERPENT survey we described above may signify a new era for marine EM exploration that is well suited for the study of fluid-tectonic processes. The interpretation of our conductivity models in terms of faulting and fluid processes builds upon an abundance of geophysical, geochemical, and geological research focused on the Nicaragua and Costa Rica region, testifying to the critical advantages that collaborative multidisciplinary efforts have to offer.