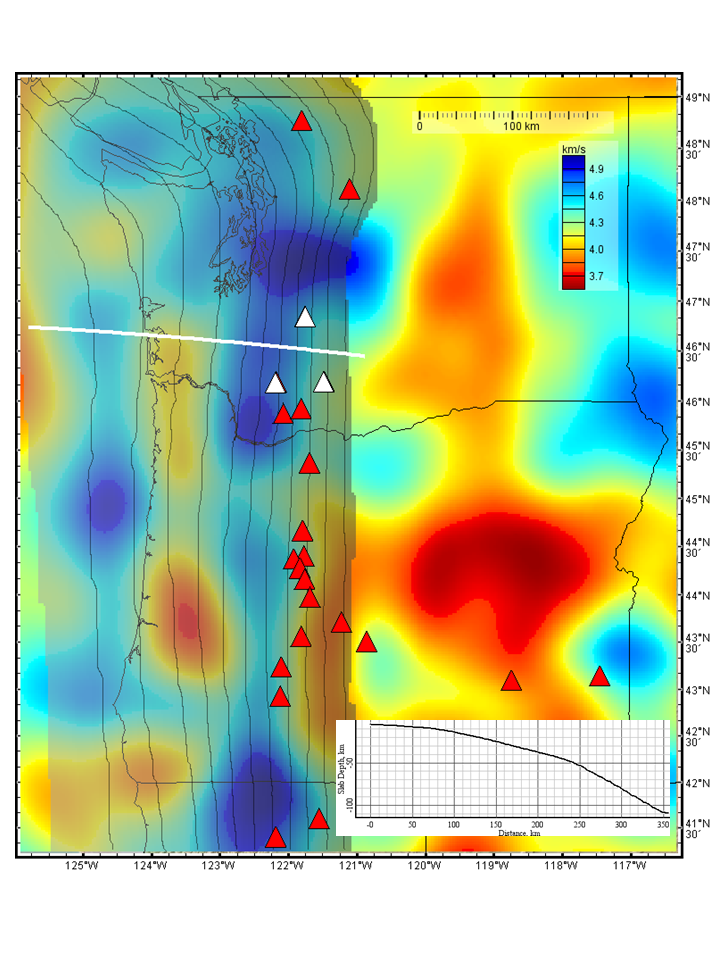
Figure 2. Cascadia lithospheric slab depth and upper mantle shear-wave velocity. The background tomographic data of Gao and Shen (2014) depicts Vs at a depth of 94 km. The seismic velocity colour scale is in the upper right. The western half of the map shows the partially-transparent depth to the top of the subducting Juan de Fuca slab from the McCrory et al. 2006 model. The 10 km contours denote slab depth between 10 km and 110 km. The planes of the tomography and slab depth models thus intersect near the eastern edge of the slab depth model where the descending slab dives through the tomographic slice. Red triangles are volcano locations from the Smithsonian Global Volcanism Project. Slab depth beneath the three highlighted white triangles marking the positions of Mount Rainier (north), Mount St. Helens (southwest) and Mount Adams (southeast) is 85 km, 68 km and 98 km respectively. The W-E white line near the Washington-Oregon border is the location of the slab depth transect shown in the lower right, taken from west to east. Image made with GeoMapApp. All of the data sets shown are accessible through the GeoMapApp menus.