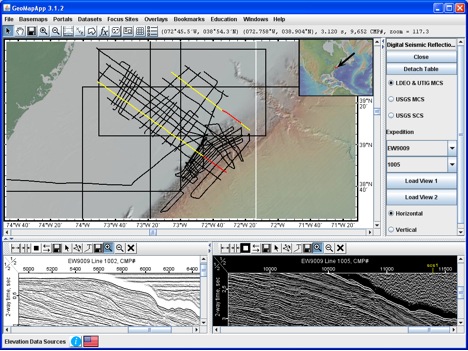
Figure 1. GeoMapApp screenshot showing Ewing EW9009 MCS lines 1002 (lower left) and 1005 (lower right, with inverse video turned on) across the New Jersey slope. The seismic lines are displayed on the map in yellow, with red portions representing the extent of the two profiles shown in the lower panes. A digitizer function allows horizons to be quickly delineated and saved to disk. The base map is the global multi-resolution topographic synthesis that offers 10m horizontal resolution of ENAM’s on-land elevations and 100m or better resolution in the oceans and on the shelves.