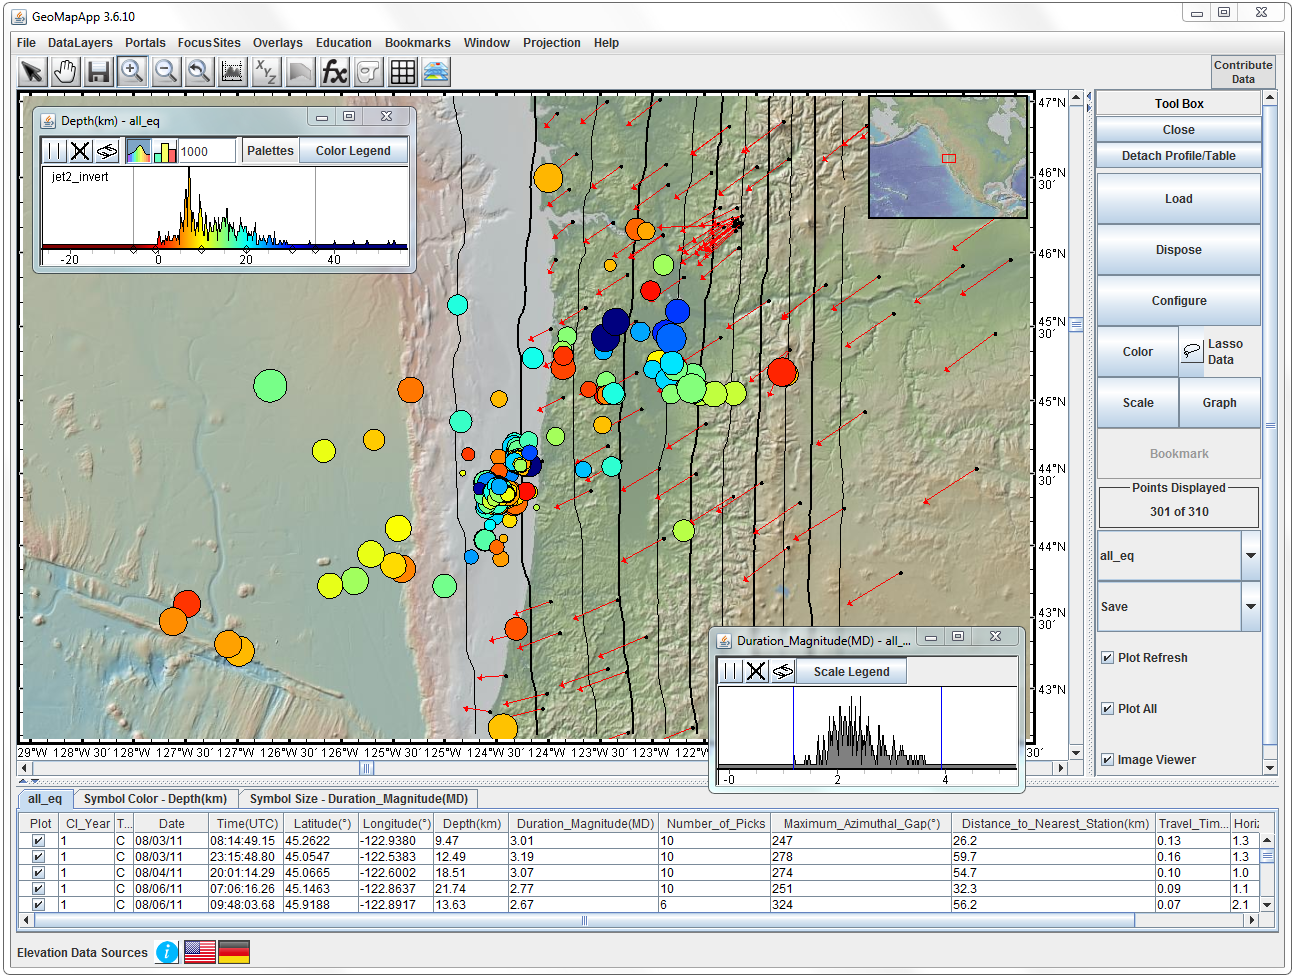
Figure 3. This Cascadia region image shows 10 km contours of depth to the subduction slab interface from McCrory et al. The microseismicity catalogue from Emily Morton is displayed as dots coloured on focus depth and scaled on duration magnitude. The red arrows are geodetic velocity vectors from the UNAVCO EarthScope PBO solutions in the IGS08 reference frame, with 10mm of arrow length equivalent to a velocity of 10 mm/year. The image is made with GeoMapApp. The geodetic data is available under the GeoMapApp Portals menu.