Donna Shillington (Lamont-Doherty Earth Observatory at Columbia University)
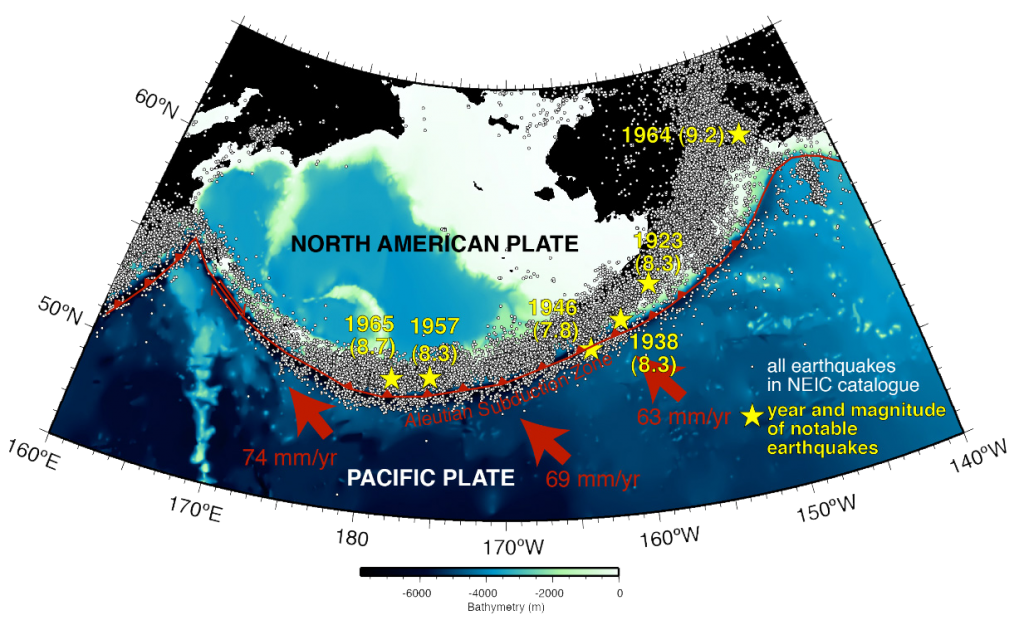
Figure 1. Simplified map of the Alaska Subduction Zone, showing distribution of catalog (white dots) and notable (yellow stars) earthquakes along the margin. Red arrows indicate absolute plate motions
The Mission: Mapping the Alaska Megathrust
The 2500-km-long subduction zone offshore southern Alaska regularly produces large, destructive earthquakes. One of the big conundrums about these settings is how large of an area locks up on the contact between these plates (called the ‘megathrust’) and then ruptures in earthquakes. To tackle this question, my colleagues and I collected data on land and at sea in the summer of 2011 to produce an image of the megathrust, constrain the properties of rocks around and within the megathrust and link these fault properties to the earthquake history here. Our expedition focused on a part of the subduction zone off the Alaska Peninsula that exhibits very big changes in slip behavior. Some parts of this plate boundary lock up and then rupture catastrophically in big earthquakes. In other areas, the plates appear to be smoothly sliding by each other and thus do not produce great earthquakes. The Semidi segment last ruptured in a great earthquake (magnitude 8.3) 73 years ago in 1938. This area has an estimated recurrence interval of ~50-75 years, and thus might be due to produce another big earthquake soon. However, just to the west lies the Shumagin gap, an area that has not produced a great earthquake historically. Imaging a major fault boundary that lies tens of miles under the seafloor is not an easy task, but we had exceptional tools for the job. We used the R/V Marcus G. Langseth to acquire seismic reflection data and onshore/offshore wide-angle reflection/refraction data. Sound waves generated by an array of air guns were recorded on two 8-km-long streamers, an array of ocean bottom seismometers and onshore seismometers.
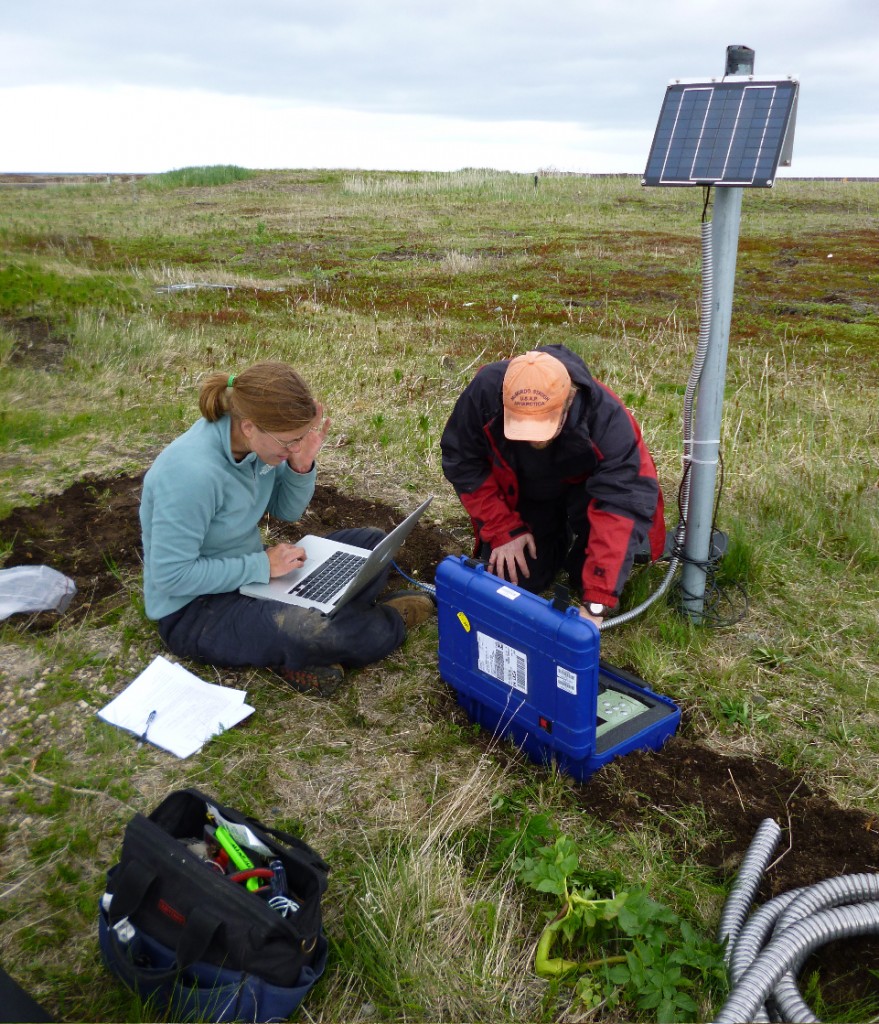
Figure 2. Katie Keranen and Guy Tytgat deploying a seismometer in Port Heiden
June 17-24: Installing seismic stations on the Alaska Peninsula
The first component of our program involved deploying seismometers onshore around the Alaska Peninsula with Katie Keranen (Univ. OK) and Guy Tytgat (PASSCAL). These instruments recorded small, local earthquakes, distant large earthquakes and (importantly for our project) the sound source of the R/V Langseth. The Alaska Peninsula is too rugged and expansive for a network of roads, so planes, helicopters or boats are the only transportation options. We decided to charter a plane based in Nelson Lagoon, a town of 80 people situated on a long, narrow sandy spit jutting out into the Bering Sea. The weather dictates when and where you can fly each day, and it varies dramatically. We were lucky enough to have several clear days (even saw some blue skies and sunshine!), but other days we were grounded by weather and wiled away the time indoors at our inn. While we were in the air, we saw majestic, snow capped volcanoes shrouded in clouds, expansive views of the sparsely vegetated Alaska Peninsula, which is riddled with rivers and lakes, and lots of wild life: caribou, bears, seals, walruses and eagles (just to name a few). It is a landscape that seems remarkably untouched by humanity.
Local communities were unwaveringly helpful and friendly in helping us find places for our stations. The two school districts here kindly granted us permission to install our seismic stations at any of their schools, and we also obtained permission to place equipment at various lodges and village offices. Residents volunteered to take our gear and us from the airstrip to our sites. In one town, our pilot made a general plea over the radio: “Is anyone listening on Channel 3? I’m here at the airstrip with scientists who need a ride to the school”. Someone answered immediately and picked us up 5 minutes later.
Many of our sites are in spectacular places near remote lodges or in towns nestled between mountains and the ocean. All of them are home to impressive wild life that poses a risk to our equipment, particularly bears. We protected the equipment against curious small animals but fully bear-proofing a station for a short (two-month-long) deployment was not feasible. Instead, we hoped that placing our stations in villages (rather than in the wild) would provide some protection, but we also needed good luck…
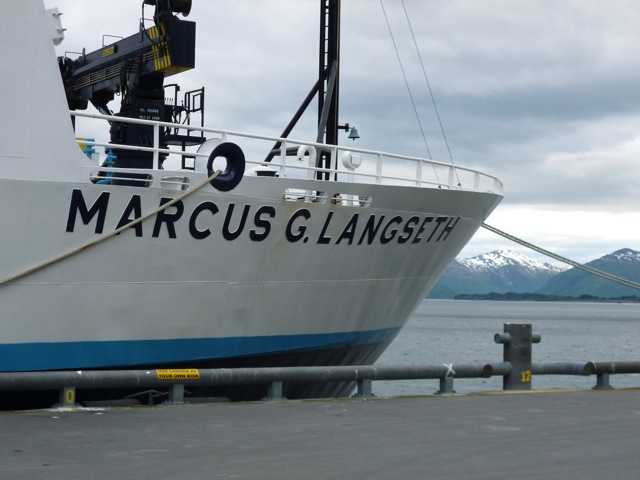
Figure 3. The R/V Langseth in port of Kodiak, with snowy mountains in the background
June 24-29: Transitioning from land to sea
Seven days and eleven flights after we arrived in Alaska, we finished deploying our seismic stations onshore. Our final constellation of stations differed a little from our original plan (as they always do), but achieved our main goal of instrumenting the part of the Alaska Peninsula nearest to our planned offshore work on the R/V Langseth. As luck would have it, we finished deploying our seismometers just in time to catch a large earthquake (magnitude 7.4) that occurred farther west in the Aleutians around the Fox Islands. After the onshore work was finished, Katie and Guy departed for home, and I flew to Kodiak to meet the R/V Langseth and our shipboard science party, including other chief scientists Mladen Nedimović (Dalhousie) and Spahr Webb (LDEO). Kodiak offered beautiful sights, delicious seafood and local beer (including Sarah Pale Ale!), but our science party was eager to leave for sea. We departed Kodiak on a sunny evening on June 29 for our 38-day-long research cruise.
June 29-July 11: Deploying and retrieving ocean bottom seismometers
The next part of our program involved using ocean bottom seismometers (OBS) to record seismic waves generated by the sound source of the Langseth. OBS’s are autonomous instruments that sit on the seafloor and record sounds waves traveling through the earth and the water. Floats made from glass balls and syntactic foam make each OBS buoyant, but an anchor holds it on the seafloor during the study. We placed OBS’s from Scripps Institution of Oceanography on the seafloor along two lines extending across the major offshore fault zone. The larger the distance between the sound source (earthquakes or air guns) and the seismometer, the deeper into the earth the recorded sound waves travel. OBS are not attached to the vessel and are also very sensitive, so they can record sound waves generated very far away (commonly >200 km). Because we want to examine deep fault zones that cause large earthquakes off Alaska, OBS are a critical part of our effort.
To deploy the OBS, we simply lifted them over the side of the ship with a large crane and gently dropped them in the water, after which they slowly sank to the seafloor. It never ceases to amaze me that we can throw a bundle of very sophisticated electronics over the side of the ship and hope to pick it up and retrieve information from it. Yet, it works! After leaving OBS on the seafloor along each line for ~3 days to record sound waves generated by the air guns of the Langseth, we returned to collect them. After receiving an acoustic signal to release from its anchor, the OBS rises through the water at 45 meters per minute. When the water is deep, it can be a long wait. Some of ours were 5500 m below the surface! The recovery of OBS always involves a certain amount of suspense. Despite all of the advanced engineering and planning that goes into these instruments, it is an inherently risky endeavor. Happily, we recovered 100% of our OBS.
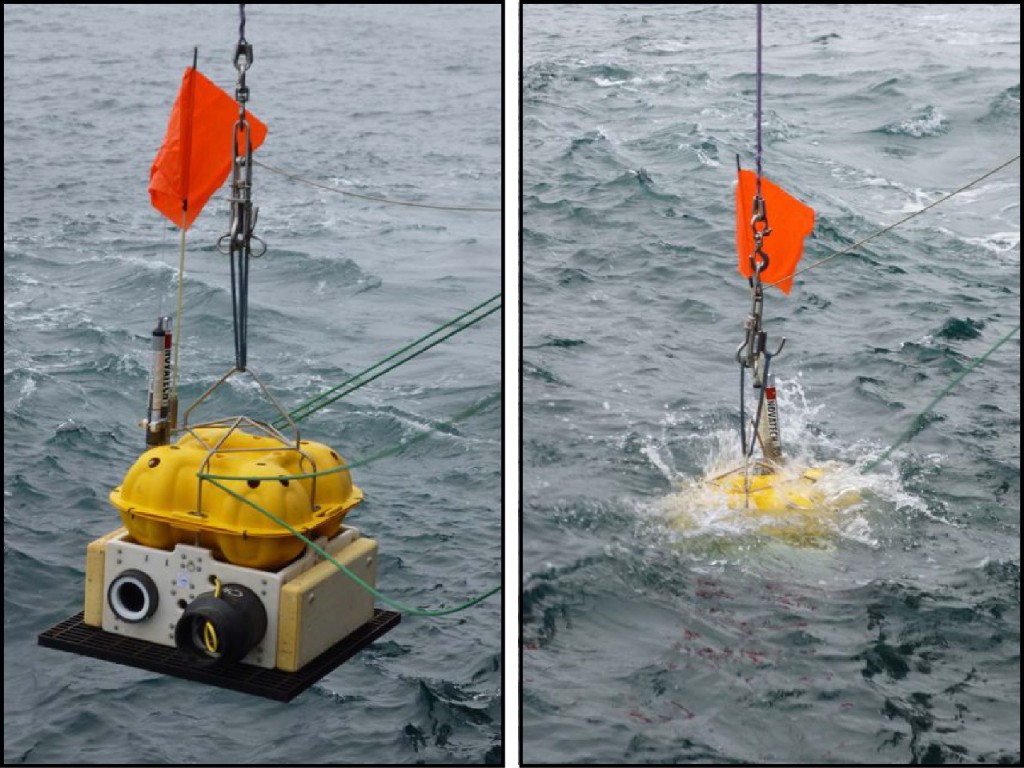
Figure 4. Deploying an OBS
Despite all the technology required to place a seismometer many miles below the ocean on the seafloor and summon it back to the surface, many aspects of actually plucking the OBS out of the ocean and pulling it on deck are remarkably low tech. Once the OBS is spotted floating on the surface, the ship drives along side. It is akin to driving your car up next to a ping-pong ball. Scientists and techs lean over the starboard side of the Langseth with large poles and attempt to attach a hook with rope to the top of the OBS. Its not always easy since the OBS is bobbing up and down on the waves. Once we hook it, we can attach a rope to the wench and haul the OBS onboard. Sometimes, OBS bring back surprises – an octopus returned with one of our OBS! He was alive and healthy, so we returned him to the ocean (though some lobbied that we keep him for lunch…)
July 11-August 5: Seismic reflection profiling with miles and miles of streamer
On July 11, we finished our OBS work, and began the second phase of the cruise: recording sound waves from the Langseth’s airgun array with two 8-km-long (5-mile-long) cables (or streamers) filled with pressure sensors. Changing gears in terms of scientific activities also involved changes to our science party; we swapped personnel by boat transfer in Sand Point on a beautiful sunny evening. The Scripps OBS team departed, and we were joined by new reinforcements, including five undergraduate students from Columbia University.
Our seismic streamers are stored on gigantic spools, which unreel cable off the back of the ship into the ocean. A large buoy is affixed to the end of the streamer, and ‘birds’ are attached along its length, which can be used to control the depth of the streamer. Large paravanes hold the streamers apart; these are like large kites flying off the back of the ship in the water. Deploying miles of streamer and the other attending gear is an impressively long and complicated undertaking, which also involves a fair amount of intense manual labor. But after 3 days, all of the gear was in the water. Once data acquisition began, we settled into a routine of watchstanding and standard shipboard data processing. Ship time is precious, so we collect data 24 hours a day, seven days a week.
One of the core objectives of our project is to image the deep parts of the plate tectonic boundary, which required us to go as far north (and as close to the coast) as possible. This was easier said that done! The southern edge of the Alaska Peninsula is rugged and flanked lots of small jagged islands and shallow features just below the surface of the ocean, and there is also more fishing activity close to the coast; both pose risks to the seismic gear. One of our closest approaches to land was near Unga, one of the Shumagin islands. At the apex of the turn, our streamers came within less than a mile of the coast. Due to some early difficulties with our equipment, we had to repeat this maneuver several times. I held my breath and watched our third (and final) pass from the bridge. After the ship and gear passed safely through the most harrowing part of the turn, the captain turned to me and asked, “We’re not going to do this again, are we?” Thankfully not! At least not there. But there were several other important parts of our survey that required close approaches to the coast to image critical parts of the boundary.
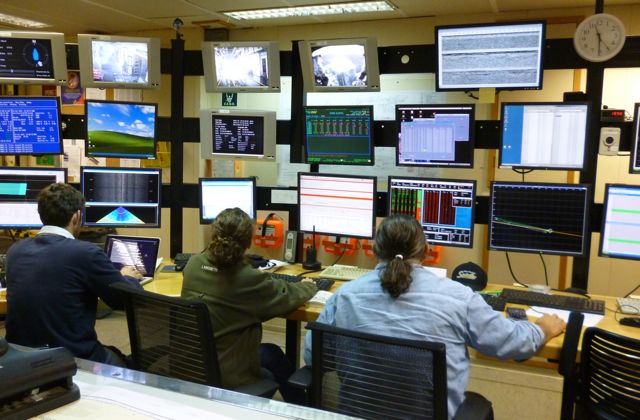
Figure 5. Watch-standers at work in the lab
Over the course of our cruise, we were treated to amazing views of marine life, including fish, whales, seals and birds. On one memorable day, we found ourselves surrounded by three species of whales, including a rare North Pacific Right Whale. But we tried to keep our distance from marine mammals. Since we are creating sound waves to image the earth, and they use sound to navigate and communicate with one another, our activities might disturb them; we suspended operations if a mammal came too close.
We used our new data to create very preliminary images of the structures below the seafloor as we went. A regular sight in the main lab was a group of people gathered around a computer screen or a large paper plot, talking and pointing excitedly. It was exhilarating to glimpse faults, sediments and other structures in our data for the first time and ponder what they might be telling us about this active plate tectonic boundary. But we have a lot of hard work ahead after the cruise to obtain concrete results from our voluminous data – we acquired over 3 Tb (3000 gigabytes!) of raw seismic data during the cruise! At 6:30 am on August 5, the R/V Langseth pulled into port in Dutch Harbor, marking the end of our very successful research cruise. Our steam into port from our study area involved a trip through Unimak pass and beautiful views of Aleutian volcanoes, including majestic Shishaldin.
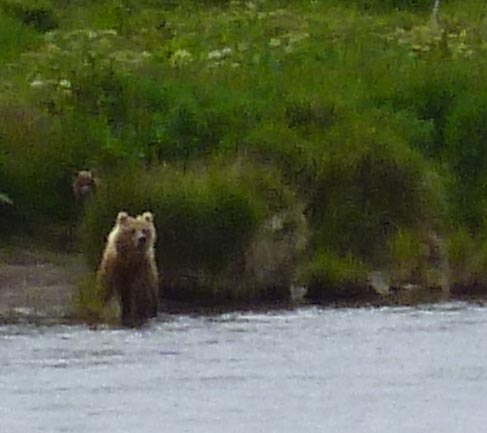
Figure 7. Bears at Bear Lake, Alaska
August 5-10: Back to the Alaska Peninsula
Many people flew home after our arrival in Dutch Harbor, but not me! (At least not immediately). Katie Keranen and I returned to the rugged Alaska peninsula to recover the land seismometers that we deployed way back at the beginning of the summer. An Anchorage-bound flight from Dutch Harbor dropped me off in Cold Bay to rendezvous with Katie. After the plane landed, the stewardess asked for our “Cold Bay passenger” to disembark. Passenger. Singular. I filed past all the folks heading to Anchorage and beyond. Katie and I returned to all of our sites by charter plane. According to our pilot, it was a very foggy summer on the Alaska Peninsula, but we were blessed with excellent weather, allowing us to pick up all of our instruments in just a day and a half. Multiple attempts were required to recover a seismometers we placed Heredeen Bay; on the first try, we saw a large brown bear only 20 feet away from the plane! But to our delight, none of the stations had been disturbed by wild life, and all of them recorded data for the entire summer. After recovering our last station at Bear Lake, we rewarded ourselves by lingering at beautiful lodge there. We tried (unsuccessfully) to catch some fish and watched bears pick through the brush on the other side of the river. And after an amazing 55 days on and around the spectacular Alaska Peninsula, I happily headed back to NYC.
Special thanks to the following:
Onshore Science Party: Katie Keranen (Univ. Oklahoma), Donna Shillington (LDEO), Guy Tytgat (Passcal Instrument Center)
Offshore Science Party: Donna Shillington (LDEO), Mladen Nedimovic’ (Dalhousie University), Spahr Webb (Lamont), along with Ann Bécel, Matthias Deleschluse, Harold Kuehn, Jiyao Li, Berta Biescas, Aaron Farkas, Andrew Wessbecher, Celia Eddy, Kelly Hostetler, Hannah Perls, Jack Zietman
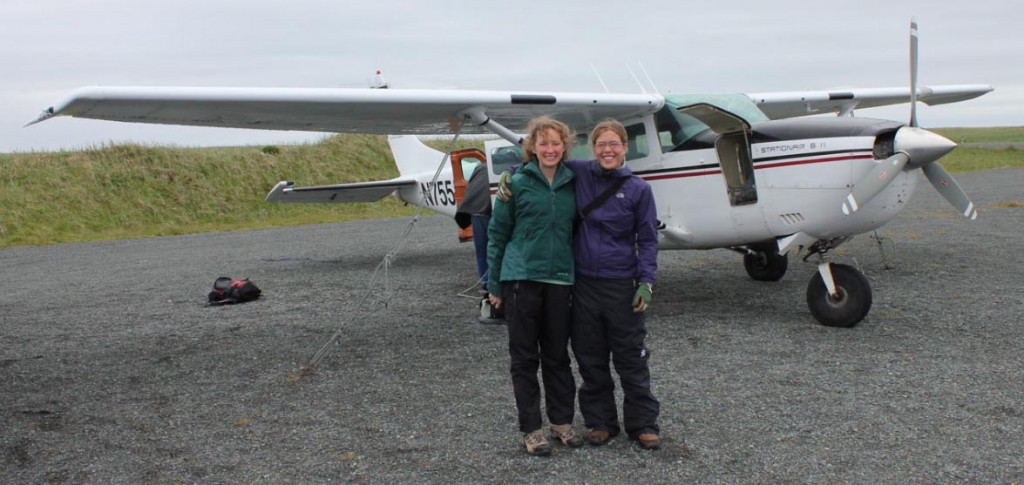
Figure 6. Donna and Katie on their way to another station.
“Report from the Field” was designed to inform the community of real-time, exciting GeoPRISMS -related research. Through this report, the authors expose the excitement, trials, and opportunities to conduct fieldwork, as well as the challenges they may have experienced by deploying research activities in unique geological settings. If you would like to contribute to this series and share your experience on the field, please contact the GeoPRISMS Office at info@geoprisms.nineplanetsllc.com. This opportunity is open to anyone engaged in GeoPRISMS research, from senior researchers to undergraduate students.
We hope to hear from you!