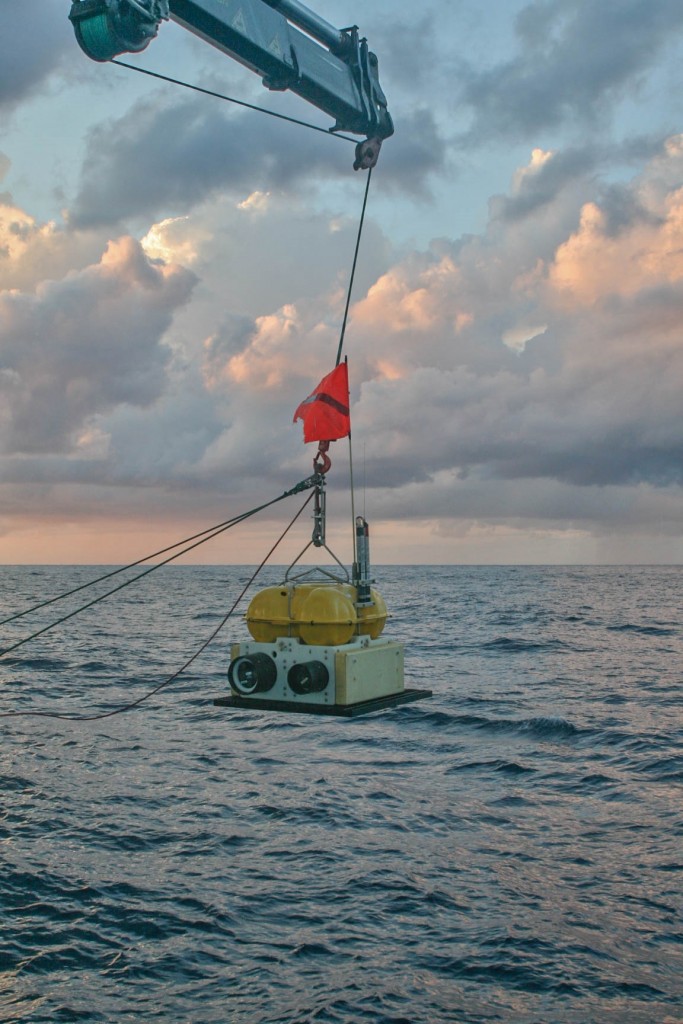
Deployment of a SCRIPPS Ocean Bottom Seismometer from the R/V Endeavor
Brandon Dugan (Rice University), Kathryn Volk (University of Michigan), Dylan Meyer (UT, Austin), Kristopher Darnell (UT, Austin), Afshin Aghayn (Oklahoma State), Pamela Moyer (University of New Hampshire), Gary Linkevitch (Rice University)
The NSF-GeoPRISMS-funded Eastern North America Margin (ENAM) Community Seismic Experiment (CSE) is a community-driven research project aimed to study continental breakup and the evolution of rifted margins. The ENAM CSE includes acquisition of passive and active-source data from broadband ocean bottom seismometers (OBSs), short-period OBSs, multi-channel seismics (MCS), and onshore seismometers (Fig.1). Data are augmented by the onshore EarthScope USArray seismometers. Together they provide coverage across the shoreline and over a range of length scales. Project data will facilitate detailed studies of the early rifting between eastern North America and northwest Africa in the Mesozoic including processes associated with the Central-Atlantic Magmatic Province (CAMP), the East Coast Magnetic Anomaly (ECMA), and the Blake Spur Magnetic Anomaly (BSMA), as well as high-resolution studies of shallow sedimentary and fluid-flow processes including Quaternary landslides and gas hydrate systems.
Another component of the ENAM CSE was engaging young scientists in the field geophysical program so they could study the eastern North America margin and be educated about the planning and implementation of a multi-investigator, multi-component research program. To accomplish this, we included young researchers (undergraduate and graduate students, post-docs, and assistant professors) in all onshore and offshore field programs. The final stage of training and education will be seismic processing workshops for the OBS and the MCS data in summer 2015. Information for applying will be distributed via GeoPRISMS and other community list-servers.
In this phase of the ENAM CSE we conducted onshore and offshore operations in September 2014. Onshore activities (led by Beatrice Magnani and Dan Lizarralde) included deploying 80 short-period seismic stations to record our offshore shots and recovering the instruments. Offshore activities included deploying and recovering 94 short-period OBSs from the R/V Endeavor (led by Harm Van Avendonk and Brandon Dugan) and shooting MCS seismic data and providing active sources for the short-period OBSs and land seismic stations from the R/V Marcus G. Langseth (led by Donna Shillington, Matt Hornbach, and Anne Becel). Together these activities yielded high quality seismic reflection and refraction data across the shoreline and down to the mantle.
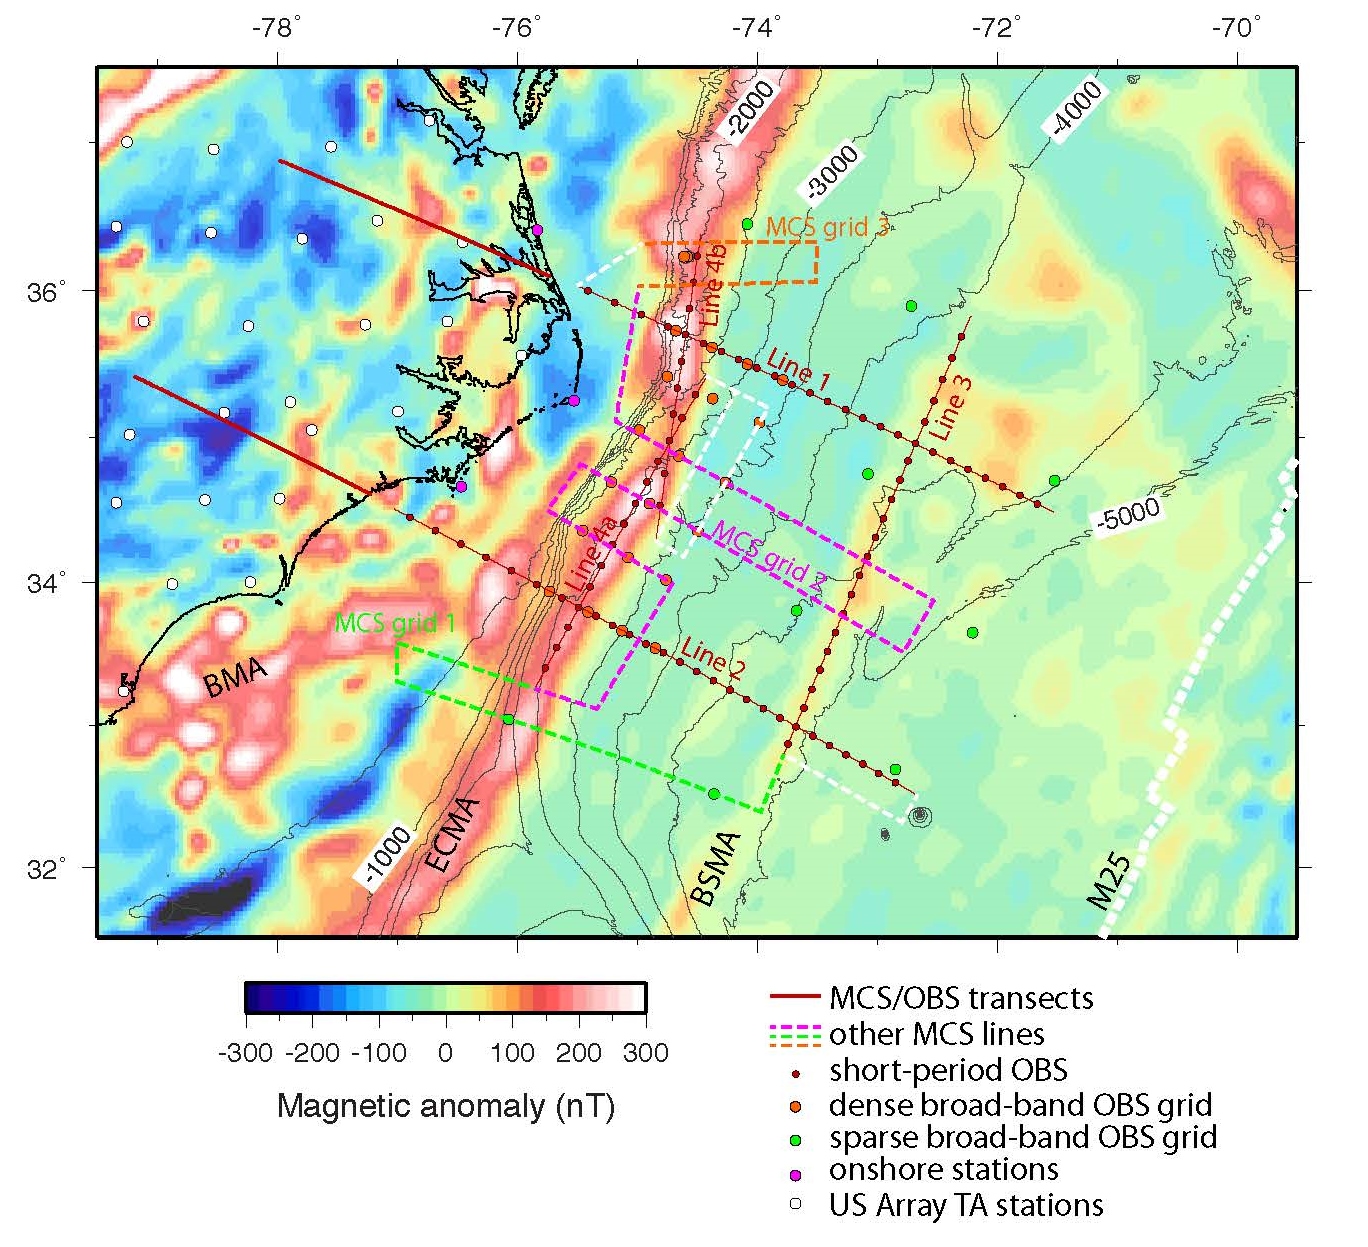
Figure 1. Idealized instrument layout and transects of the ENAM Community Seismic Experiment.


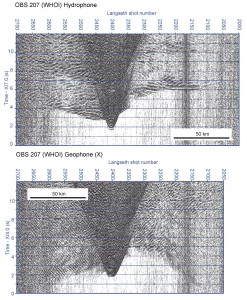
Record sections of hydrophone (top) and geophone (bottom) of OBS207. This was an instrument from the WHOI OBSIP group.


“Report from the Field” was designed to inform the community of real-time, exciting GeoPRISMS -related research. Through this report, the authors expose the excitement, trials, and opportunities to conduct fieldwork, as well as the challenges they may have experienced by deploying research activities in unique geological settings. If you would like to contribute to this series and share your experience on the field, please contact the GeoPRISMS Office at info@geoprisms.nineplanetsllc.com. This opportunity is open to anyone engaged in GeoPRISMS research, from senior researchers to undergraduate students.
We hope to hear from you!